Data Series 780
|
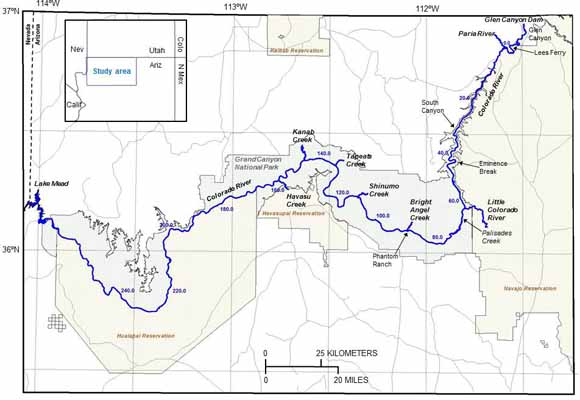
AbstractThe Grand Canyon Monitoring and Research Center (GCMRC) of the U.S. Geological Survey (USGS) periodically collects airborne image data for the Colorado River corridor within Arizona (fig. 1) to allow scientists to study the impacts of Glen Canyon Dam water release on the corridor’s natural and cultural resources. These data are collected from just above Glen Canyon Dam (in Lake Powell) down to the entrance of Lake Mead, for a total distance of 450 kilometers (km) and within a 500-meter (m) swath centered on the river’s mainstem and its seven main tributaries (fig. 1). The most recent airborne data collection in 2009 acquired image data in four wavelength bands (blue, green, red, and near infrared) at a spatial resolution of 20 centimeters (cm). The image collection used the latest model of the Leica ADS40 airborne digital sensor (the SH52), which uses a single optic for all four bands and collects and stores band radiance in 12-bits. Davis (2012) reported on the performance of the SH52 sensor and on the processing steps required to produce the nearly flawless four-band image mosaic (sectioned into map tiles) for the river corridor. The final image mosaic has a total of only 3 km of surface defects in addition to some areas of cloud shadow because of persistent inclement weather during data collection. The 2009 four-band image mosaic is perhaps the best image dataset that exists for the entire Arizona part of the Colorado River.Some analyses of these image mosaics do not require the full 12-bit dynamic range or all four bands of the calibrated image database, in which atmospheric scattering (or haze) had not been removed from the four bands. To provide scientists and the general public with image products that are more useful for visual interpretation, the 12-bit image data were converted to 8-bit natural-color and color-infrared images, which also removed atmospheric scattering within each wavelength-band image. The conversion required an evaluation of the histograms of each band’s digital-number population within each map tile throughout the corridor and the determination of the digital numbers corresponding to the lower and upper one percent of the picture-element population within each map tile. Visual examination of the image tiles that were given a 1-percent stretch (whereby the lower 1- percent 12-bit digital number is assigned an 8-bit value of zero and the upper 1-percent 12-bit digital number is assigned an 8-bit value of 255) indicated that this stretch sufficiently removed atmospheric scattering, which provided improved image clarity and true natural colors for all surface materials. The lower and upper 1-percent, 12-bit digital numbers for each wavelength-band image in the image tiles exhibit erratic variations along the river corridor; the variations exhibited similar trends in both the lower and upper 1-percent digital numbers for all four wavelength-band images (figs. 2–5). The erratic variations are attributed to (1) daily variations in atmospheric water-vapor content due to monsoonal storms, (2) variations in channel water color due to variable sediment input from tributaries, and (3) variations in the amount of topographic shadows within each image tile, in which reflectance is dominated by atmospheric scattering. To make the surface colors of the stretched, 8-bit images consistent among adjacent image tiles, it was necessary to average both the lower and upper 1-percent digital values for each wavelength-band image over 20 river miles to subdue the erratic variations. The average lower and upper 1-percent digital numbers for each image tile (figs. 2–5) were used to convert the 12-bit image values to 8-bit values and the resulting 8-bit four-band images were stored as natural-color (red, green, and blue wavelength bands) and color-infrared (near-infrared, red, and green wavelength bands) images in embedded geotiff format, which can be read and used by most geographic information system (GIS) and image-processing software. The tiff world files (tfw) are provided, even though they are generally not needed for most software to read an embedded geotiff image. All image data are projected in the State Plane (SP) map projection using the central Arizona zone (202) and the North American Datum of 1983 (NAD83). The map-tile scheme used to segment the corridor image mosaic followed the standard USGS quarter-quadrangle (QQ) map borders, but the high resolution (20 cm) of the images required further quarter segmentation (QQQ) of the standard QQ tiles, where the image mosaic covered a large fraction of a QQ map tile (segmentation shown in (figure 6), where QQ_1 to QQ_4 shows the number convention used to designate a quarter of a QQ tile). To minimize the size of each image tile, each image or map tile was subset to only include that part of the tile that had image data. In addition, some QQQ image tiles within a QQ tile were combined when adjacent QQQ map tiles were small. Thus, some image tiles consist of combinations of QQQ map tiles, some consist of an entire QQ map tile, and some consist of two adjoining QQ map tiles. The final image tiles number 143, which is a large number of files to list on the Internet for both the natural-color and color-infrared images. Thus, the image tiles were placed in seven file folders based on the one-half-degree geographic boundaries within the study area (fig. 7). The map tiles in each file folder were compressed to minimize folder size for more efficient downloading. The file folders are sequentially referred to as zone 1 through zone 7, proceeding down river (fig. 7). The QQ designations of the image tiles contained within each folder or zone are shown on the index map for each respective zone (figs. 8–14). Reference CitedDavis, P.A., 2012, Airborne digital-image data for monitoring the Colorado River corridor below Glen Canyon Dam, Arizona, 2009—Image-mosaic production and comparison with 2002 and 2005 image mosaics: U.S. Geological Survey Open-File Report 2012–1139, 82 p., https://pubs.usgs.gov/of/2012/1139/. |
First posted July 8, 2013
For additional information contact: Part of this report is presented in Portable Document Format (PDF); the latest version of Adobe Reader or similar software is required to view it. Download the latest version of Adobe Reader, free of charge. |
Davis, P.A., 2013, Natural-color and color-infrared image mosaics of the Colorado River corridor in Arizona derived from the May 2009 airborne image collection: U.S. Geological Survey Data Series 780, https://pubs.usgs.gov/ds/780/.

![]() U.S. Department of the Interior |
U.S. Geological Survey
U.S. Department of the Interior |
U.S. Geological Survey
URL: http://pubsdata.usgs.gov/pubs/ds/780/index.html
Page Contact Information: GS Pubs Web Contact
Page Last Modified: Monday, 28-Nov-2016 19:14:00 EST