Backscatter B [7125]--Offshore Half Moon Bay, California

Metadata also available as - [Outline] - [Parseable text] - [XML]

Frequently anticipated questions:


What does this data set describe?

Title: Backscatter B [7125]--Offshore Half Moon Bay, California
Abstract:
This part of DS 781 presents data for the acoustic-backscatter map of the Offshore of Half Moon Bay map area, California. Backscatter data are provided as two separate grids depending on mapping system (Reson 7125 and Reson 8101). The raster data file is included in "BackscatterB_7125_OffshoreHalfMoonBay.zip," which is accessible from <https://pubs.usgs.gov/ds/781/OffshoreHalfMoonBay/data_catalog_OffshoreHalfMoonBay.html>.

The acoustic-backscatter map of the Offshore of Half Moon Bay, California was generated from backscatter data collected by Fugro Pelagos and by California State University, Monterey Bay (CSUMB). Mapping was completed in 2006 and 2007, using a combination of 400-kHz Reson 7125 and 244-kHz Reson 8101 multibeam echosounders. Within the final imagery, brighter tones indicate higher backscatter intensity, and darker tones indicate lower backscatter intensity. The intensity represents a complex interaction between the acoustic pulse and the seafloor, as well as characteristics within the shallow subsurface, providing a general indication of seafloor texture and composition. Backscatter intensity depends on the acoustic source level; the frequency used to image the seafloor; the grazing angle; the composition and character of the seafloor, including grain size, water content, bulk density, and seafloor roughness; and some biological cover. Harder and rougher bottom types such as rocky outcrops or coarse sediment typically return stronger intensities (high backscatter, lighter tones), whereas softer bottom types such as fine sediment return weaker intensities (low backscatter, darker tones).
  1. How should this data set be cited?

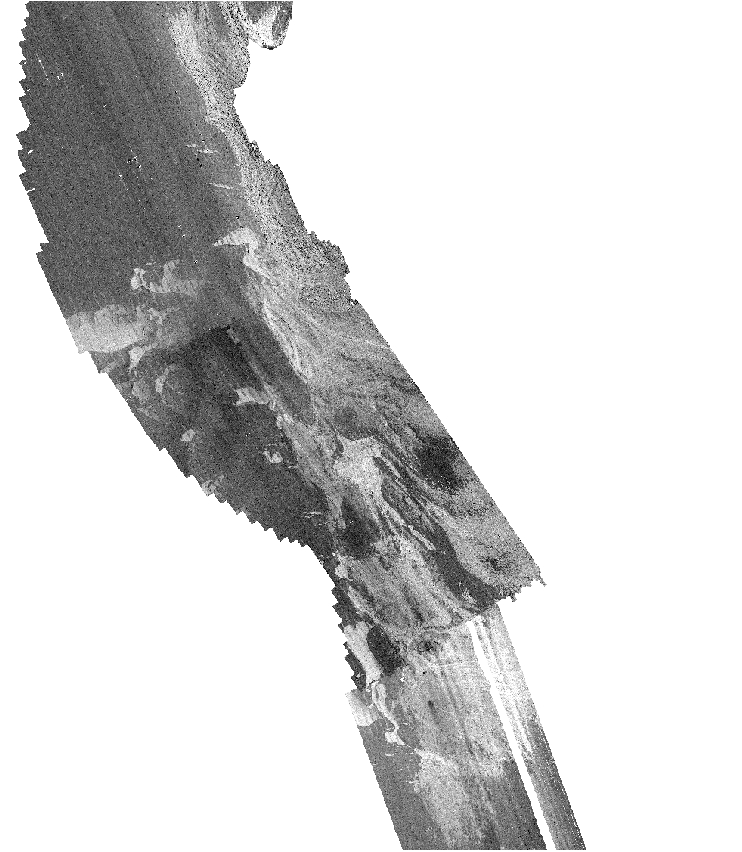
    Bretz, Carrie K., Kvitek, Rikk G., Dartnell, Peter, and Phillips, Eleyne L., 2014, Backscatter B [7125]--Offshore Half Moon Bay, California:.

    This is part of the following larger work.

    Cochrane, Guy R., Dartnell, Peter, Greene, H. Gary, Johnson, Samuel Y., Golden, Nadine E., Hartwell, Stephen R., Dieter, Brian E., Mansion, Michael W., Sliter, Ray W., Ross, Stephanie L., Watt, Janet T., Endris, Charles A., Kvitek, Rikk G., Edwards, Brian D., Phillips, Eleyne L., Erdey, Mercedes D., Bretz, Carrie K., Chin, John L., and Bretz, Carrie K., 2014, California State Waters Map Series--Offshore of Half Moon Bay map area, California: Open-File Report OFR 2014-1214, U.S. Geological Survey, Reston, VA.

    Online Links:

  2. What geographic area does the data set cover?

    West_Bounding_Coordinate: -122.60
    East_Bounding_Coordinate: -122.39
    North_Bounding_Coordinate: 37.54
    South_Bounding_Coordinate: 37.38

  3. What does it look like?

    <https://pubs.usgs.gov/ds/781/OffshoreHalfMoonBay/images/BackscatterB_7125_OffshoreHalfMoonBay.jpg> (JPEG)
    Acoustic backscatter imagery of offshore Half Moon Bay.

  4. Does the data set describe conditions during a particular time period?

    Beginning_Date: 2006
    Ending_Date: 2007
    Currentness_Reference: ground condition

  5. What is the general form of this data set?

    Geospatial_Data_Presentation_Form: GeoTiff

  6. How does the data set represent geographic features?

    1. How are geographic features stored in the data set?

      This is a Raster data set. It contains the following raster data types:

      • Dimensions, type Grid Cell

    2. What coordinate system is used to represent geographic features?

      Grid_Coordinate_System_Name: Universal Transverse Mercator
      Universal_Transverse_Mercator:
      UTM_Zone_Number: 10
      Transverse_Mercator:
      Scale_Factor_at_Central_Meridian: 0.9996
      Longitude_of_Central_Meridian: -123.00000
      Latitude_of_Projection_Origin: 0.00000
      False_Easting: 500000.0
      False_Northing: 0.00

      Planar coordinates are encoded using coordinate pair
      Abscissae (x-coordinates) are specified to the nearest 2.0
      Ordinates (y-coordinates) are specified to the nearest 2.0
      Planar coordinates are specified in Meters

      The horizontal datum used is WGS84.
      The ellipsoid used is WGS84.
      The semi-major axis of the ellipsoid used is 6378137.00 meters.
      The flattening of the ellipsoid used is 1/298.257223563.

  7. How does the data set describe geographic features?

    Entity_and_Attribute_Overview:
    The merged Reson 7125 acoustic-backscatter grid was originally archived as an ESRI grid with the following attributes:
    Cell size = 2.0
    Number of rows = 8980
    Number of columns = 8975
    
    Data type = floating point
    
    Boundary
    Xmin = 535610
    Xmax = 553560
    Ymin = 4137800
    Ymax = 4155760
    
    Statistics
    Minimum value = 0
    Maximum value = 254
    Mean = 146.63
    Standard deviation = 34.77
    
    Coordinate system description
    Projection  UTM
    Zone  10
    Datum  WGS84
    Units  meter
    
    The merged Reson 8101 acoustic-backscatter grid was originally archived as an ESRI grid with the following attributes:
    Cell size = 2.0
    Number of rows = 8980
    Number of columns = 8975
    
    Data type = floating point
    
    Boundary
    Xmin = 535600
    Xmax = 553540
    Ymin = 4137780
    Ymax = 4155740
    
    Statistics
    Minimum value = 0
    Maximum value = 254
    Mean = 151.33
    Standard deviation = 55.38
    
    Coordinate system description
    Projection  UTM
    Zone  10
    Datum  WGS84
    Units  meter
    
    Entity_and_Attribute_Detail_Citation: none


Who produced the data set?

  1. Who are the originators of the data set? (may include formal authors, digital compilers, and editors)

  2. Who also contributed to the data set?

  3. To whom should users address questions about the data?

    Peter Dartnell
    U.S. Geological Survey, Pacific Coastal and Marine Science Center
    Physical Scientist
    400 Natural Bridges Dr.
    Santa Cruz, CA 95060-5792
    USA

    (831) 460-7415 (voice)
    (831) 427-4709 (FAX)
    pdartnell@usgs.gov


Why was the data set created?

These data are intended for science researchers, students, policy makers, and the general public. This information is not intended for navigational purposes. These data can be used with geographic information systems or other software.


How was the data set created?

  1. From what previous works were the data drawn?

  2. How were the data generated, processed, and modified?

    Date: 2007 (process 1 of 2)
    During the mapping missions, an Applanix position and motion compensation system (POS/MV) was used to accurately position the vessel during data collection, and it also accounted for vessel motion such as heave, pitch, and roll (position accuracy, ±2 m; pitch, roll, and heading accuracy, ±0.02 degress; heave accuracy, ±5 percent, or 5 cm). KGPS altitude data (Fugro Pelagos, StarFix HP & XP units; CSUMB, NavCom 2050) were used to account for tide cycle fluctuations and sound velocity profiles were collected with an Applied Microsystems SVPlus sound velocimeter. Soundings were corrected for vessel motion using the Applanix POS/MV data, for variations in water-column sound velocity using the AM SVPlus data, and for variations in water height (tides) using vertical-position data from the KGPS receivers. Backscatter data were processed using Geocoder Version 3.2 (Fugro Pelagos Modified Test Release 16). Within Geocoder, the backscatter intensities were radiometrically corrected (including despeckling and angle varying gain adjustments) and the position of each acoustic sample was geometrically corrected for slant range. After the lines were imported, they were mosaicked into a 1m resolution image. Overlap between parallel lines was resolved using a priority table based on the distance of each sample from the ship track, with samples closest to- and furthest from- the ship track given the lowest priority. An anti-aliasing algorithm was also applied.

    Person who carried out this activity:

    Carrie Bretz
    Seafloor Mapping Lab, California State University Monterey Bay
    Projects Manager, GIS; Metadata Supervisor
    100 Campus Center, Bldg 13
    Seaside, CA 93955
    USA

    (831) 582-4197 (voice)
    carrie_bretz@csumb.edu

    Date: 2009 (process 2 of 2)
    California Seafloor Mapping Project 1- and 2-m resolution backscatter imagery (CSMP survey blocks CC-03, CC-05, CC-06, and CC-07) within this map were downloaded from California State University, Monterey Bay, Seafloor Mapping Lab (<http://seafloor.csumb.edu/SFMLwebDATA.htm>) and converted to grids. Backscatter grids of similar mapping systems were merged in a GIS and clipped to the boundary of the map area. Grids from different mapping systems were not merged together due to different mapping frequencies and processing techniques.

    Person who carried out this activity:

    Pete Dartnell
    U.S. Geological Survey, Pacific Coastal and Marine Science Center
    Physical Scientist
    400 Natural Bridges Dr.
    Santa Cruz, CA 95060-5792
    USA

    (831) 460-7415 (voice)
    pdartnell@usgs.gov

  3. What similar or related data should the user be aware of?


How reliable are the data; what problems remain in the data set?

  1. How well have the observations been checked?

    Not applicable for raster data.

  2. How accurate are the geographic locations?

    Estimated to be no less than 2 m, owing to water depth and total propagated uncertainties of the mapping systems, which include sonar system, position and motion compensation system, and navigation, as well as data processing that includes sounding cleaning, gridding, and datum transformations.

  3. How accurate are the heights or depths?

    Estimated to be no less than 20 cm, owing to water depth and total propagated uncertainties of the mapping systems, which include sonar system, position and motion compensation system, and navigation, as well as data processing that includes sounding cleaning, gridding, and datum transformations.

  4. Where are the gaps in the data? What is missing?

    Complete

  5. How consistent are the relationships among the observations, including topology?

    Unspecified


How can someone get a copy of the data set?

Are there legal restrictions on access or use of the data?

Access_Constraints: None
Use_Constraints:

Please recognize the U.S. Geological Survey (USGS) and California State University, Monterey Bay, Seafloor Mapping Lab (CSUMB). USGS-authored or produced data and information are in the public domain.
This information is not intended for navigational purposes.
Read and fully comprehend the metadata prior to data use. Uses of these data should not violate the spatial resolution of the data.
Where these data are used in combination with other data of different resolution, the resolution of the combined output will be limited by the lowest resolution of all the data.
Acknowledge the U.S. Geological Survey in products derived from these data. Share data products developed using these data with the U.S. Geological Survey.
This database has been approved for release and publication by the Director of the USGS. Although this database has been subjected to rigorous review and is substantially complete, the USGS reserves the right to revise the data pursuant to further analysis and review. Furthermore, it is released on condition that neither the USGS nor the United States Government may be held liable for any damages resulting from its authorized or unauthorized use.
Although this Federal Geographic Data Committee-compliant metadata file is intended to document these data in nonproprietary form, as well as in ArcInfo format, this metadata file may include some ArcInfo-specific terminology.


Who wrote the metadata?

Dates:
Last modified: 17-Jun-2013
Last Reviewed: 21-Aug-2014
Metadata author:
Peter Dartnell
U.S. Geological Survey, Pacific Coastal and Marine Science Center
Physical Scientist
400 Natural Bridges Dr.
Santa Cruz, CA 95060-5792
USA

(831) 460-7415 (voice)
(831) 427-4709 (FAX)
pdartnell@usgs.gov

Metadata standard:
Content Standard for Digital Geospatial Metadata ("CSDGM version 2") (FGDC-STD-001-1998)


Generated by mp version 2.9.16 on Wed Jan 21 17:05:04 2015