Geology and geomorphology--Offshore of Pacifica map area, California

Metadata also available as - [Outline] - [Parseable text] - [XML]

Frequently anticipated questions:


What does this data set describe?

Title:
Geology and geomorphology--Offshore of Pacifica map area, California
Abstract:
This part of DS 781 presents data for the geologic and geomorphic map of the Offshore of Pacifica map area, California. The vector data file is included in "Geology_OffshorePacifica.zip," which is accessible from <https://pubs.usgs.gov/ds/781/OffshorePacifica/data_catalog_OffshorePacifica.html>.
The continental shelf within California's State waters in the Pacifica area is shallow (water depths of 0 to about 40 m) and flat continental shelf with a very gentle (less than 0.5 degrees) offshore dip. The morphology and geology of this shelf result from the interplay between local tectonics, sea-level rise, sedimentary processes, and oceanography. Tectonic influences are related to local faulting and uplift (see below). Sea level has risen about 125 to 130 m over the last about 21,000 years (for example, Lambeck and Chappel, 2001; Gornitz, 2009), leading to progressive eastward migration (a few tens of km) of the shoreline and wave-cut platform, and associated transgressive erosion and deposition (for example, Catuneanu, 2006). The Offshore of Pacifica map area is now mainly an open shelf that is subjected to full, and sometimes severe, Pacific Ocean wave energy and strong currents. Most of the offshore map area is covered by marine sediments; artificial fill (unit af) occurs only at the site of the Pacifica Pier. Given their relatively shallow depths and exposure to high wave energy, modern shelf deposits are mostly sand (unit Qms). More coarse-grained sands and gravels (units Qmss and Qmsc) are primarily recognized on the basis of bathymetry and high backscatter (Bathymetry--Offshore of Pacifica map area, California, and Backscatter--Offshore of Pacifica map area, California). Unit Qmsc occurs as nearshore bars (less than 12 m water depth) for about two kilometers north of Mussel Rock and more locally offshore Pacifica, and in two isolated patches farther offshore at about 25 m water depth. Unit Qmss forms erosional lags in features known as "rippled scour depressions" (for example, Cacchione and others, 1984) or "sorted bedforms" (for example, Trembanis and Hume, 2011), at water depths of about 15 to 25 m, in contact with offshore bedrock uplifts and unit Qms. Such features are common along this stretch of the California coast where offshore sandy sediment can be relatively thin (thus unable to fill the depressions) due to both lack of sediment supply from rivers and to significant sediment erosion and offshore transport during large winter storms. Although the general areas in which both unit Qmss scour depressions and unit Qmsc bars occur are not likely to change substantially, the boundaries of the unit(s) are likely ephemeral, changing seasonally and during significant storm events. Areas where shelf sediments form thin (less than 2 m) veneers over low relief bedrock of the Franciscan Complex (see below) occur in the northern half of the map and are mapped as unit Qms/KJf. This hybrid unit is recognized and delineated based on the combination of flat relief, continuity with moderate to high relief onshore or offshore bedrock outcrops, high-resolution seismic-reflection data, and in some cases moderate to high backscatter. The thin sediment layer is regarded as ephemeral and dynamic, and may or may not be present at a specific location based on storms, seasonal to annual patterns of sediment movement, or longer-term climate cycles. In a nearby, similarly high-energy setting, Storlazzi and others (2011) have described seasonal burial and exhumation of submerged bedrock in northern Monterey Bay. Offshore bedrock exposed at the seafloor is mapped as Jurassic and Cretaceous Franciscan Complex, undivided (unit KJf); Cretaceous granite (unit Kgr); Tertiary and (or) Cretaceous rock, undivided (unit TKu); unnamed sansdstone, shale and conglomerate of Paleocene age (unit Tss); and the Upper Miocene and Pliocene Purisima Formation (unit Tp). These units are delineated by extending outcrops and trends from mapped onshore geology and from their distinctive surface textures as revealed by high-resolution bathymetry (Bathymetry--Offshore of Pacifica map area, California). Purisima Formation outcrops in the southernmost part of the offshore map area form distinctive "ribs," caused by differential erosion of variably resistant, interbedded lithologies (for example, sandstone and mudstone). In contrast, granitic rocks have a densely cross-fractured, rough surface texture, and both the Franciscan Complex and the unnamed Paleocene sedimentary unit have a more masssive, irregular, and smoother surface texture. Purisima Formation outcrops occur in water as deep as 35 m, whereas other bedrock units occur in shallower (less than 20 m) water depths, most commonly adjacent to coastal points underlain by bedrock (for example, Pedro Point and Montara Point). Map unit polygons were digitized over underlying 2-meter base layers developed from multibeam bathymetry and backscatter data. The bathymetry and backscatter data were collected between 2006 and 2010.
References Cited
Cacchione, D.A., Drake, D.E., Grant, W.D., and Tate, G.B., 1984. Rippled scour depressions of the inner continental shelf off central California: Journal of Sedimentary Petrology, v 54, p. 1280-1291.
Catuneanu, O., 2006, Principles of Sequence Stratigraphy: Amsterdam, Elsevier, 375 p.
Gornitz, V., 2009, Sea level change, post-glacial, in Gornitz, V., ed., Encyclopedia of Paleoclimatology and Ancient Environments: Encyclopedia of Earth Sciences Series. Springer, pp. 887-893.
Lambeck, K., and Chappell, J., 2001, Sea level change through the last glacial cycle: Science, v. 292, p. 679-686.
Trembanis, A.C., and Hume, T.M., 2011, Sorted bedforms on the inner shelf off northeastern New Zealand: spatiotemporal relationships and potential paleo-evironmental implications: Geo-Marine Letters, v. 31, p. 203-214.
Supplemental_Information:

Map political location: San Mateo County, California Compilation scale: 1:24,000 Base maps used are hillshades generated from IfSAR, LiDAR, and multibeam mapping both onshore and offshore (Bathymetry--Offshore of Pacifica map area, California, DS 781, for more information).
  1. How should this data set be cited?

    Greene, H.G., Hartwell, S.R., Manson, M.W., Johnson, S.Y., Dieter, B.E., Phillips, E.L., and Watt, J.T., 2014, Geology and geomorphology--Offshore of Pacifica map area, California:.

    This is part of the following larger work.

    Edwards, Brian D., Phillips, Eleyne L., Dartnell, Peter, Greene, H. Gary, Bretz, Carrie K., Kvitek, Rikk G., Hartwell, Stephen R., Johnson, Samuel Y., Cochrane, Guy R., Dieter, Brian E., Sliter, Ray W., Ross, Stephanie L., Golden, Nadine E., Watt, Janet T., Chin, John L., Erdey, Mercedes D., Krigsman, Lisa M., Mansion, Michael W., and Endris, Charles A., 2014, California State Waters Map Series--Offshore of Pacifica map area, California: Open-File Report OFR 2014-1260, U.S. Geological Survey, Reston, VA.

    Online Links:

  2. What geographic area does the data set cover?

    West_Bounding_Coordinate: -122.588071
    East_Bounding_Coordinate: -122.493750
    North_Bounding_Coordinate: 37.702237
    South_Bounding_Coordinate: 37.540691

  3. What does it look like?

    <https://pubs.usgs.gov/ds/781/OffshorePacifica/images/Geology_OffshorePacifica.jpg> (JPEG)
    Geology offshore Pacifica.

  4. Does the data set describe conditions during a particular time period?

    Beginning_Date: 2006
    Ending_Date: 2010
    Currentness_Reference: ground condition

  5. What is the general form of this data set?

    Geospatial_Data_Presentation_Form: vector digital data

  6. How does the data set represent geographic features?

    1. How are geographic features stored in the data set?

      This is a Vector data set. It contains the following vector data types (SDTS terminology):

      • GT-polygon composed of chains (188)

    2. What coordinate system is used to represent geographic features?

      The map projection used is WGS 1984 UTM Zone 10N.

      Projection parameters:
      Scale_Factor_at_Central_Meridian: 0.9996
      Longitude_of_Central_Meridian: -123.0
      Latitude_of_Projection_Origin: 0.0
      False_Easting: 500000.0
      False_Northing: 0.0

      Planar coordinates are encoded using coordinate pair
      Abscissae (x-coordinates) are specified to the nearest 0.0001
      Ordinates (y-coordinates) are specified to the nearest 0.0001
      Planar coordinates are specified in Meter

      The horizontal datum used is D WGS 1984.
      The ellipsoid used is WGS 1984.
      The semi-major axis of the ellipsoid used is 6378137.0.
      The flattening of the ellipsoid used is 1/298.257223563.

  7. How does the data set describe geographic features?

    MapUnitPolys
    Polygons representing geologic / geomorphic map units (Source: This report)

    OBJECTID
    Internal feature number. (Source: ESRI)

    Sequential unique whole numbers that are automatically generated.

    Shape
    Feature geometry. (Source: ESRI)

    Coordinates defining the features.
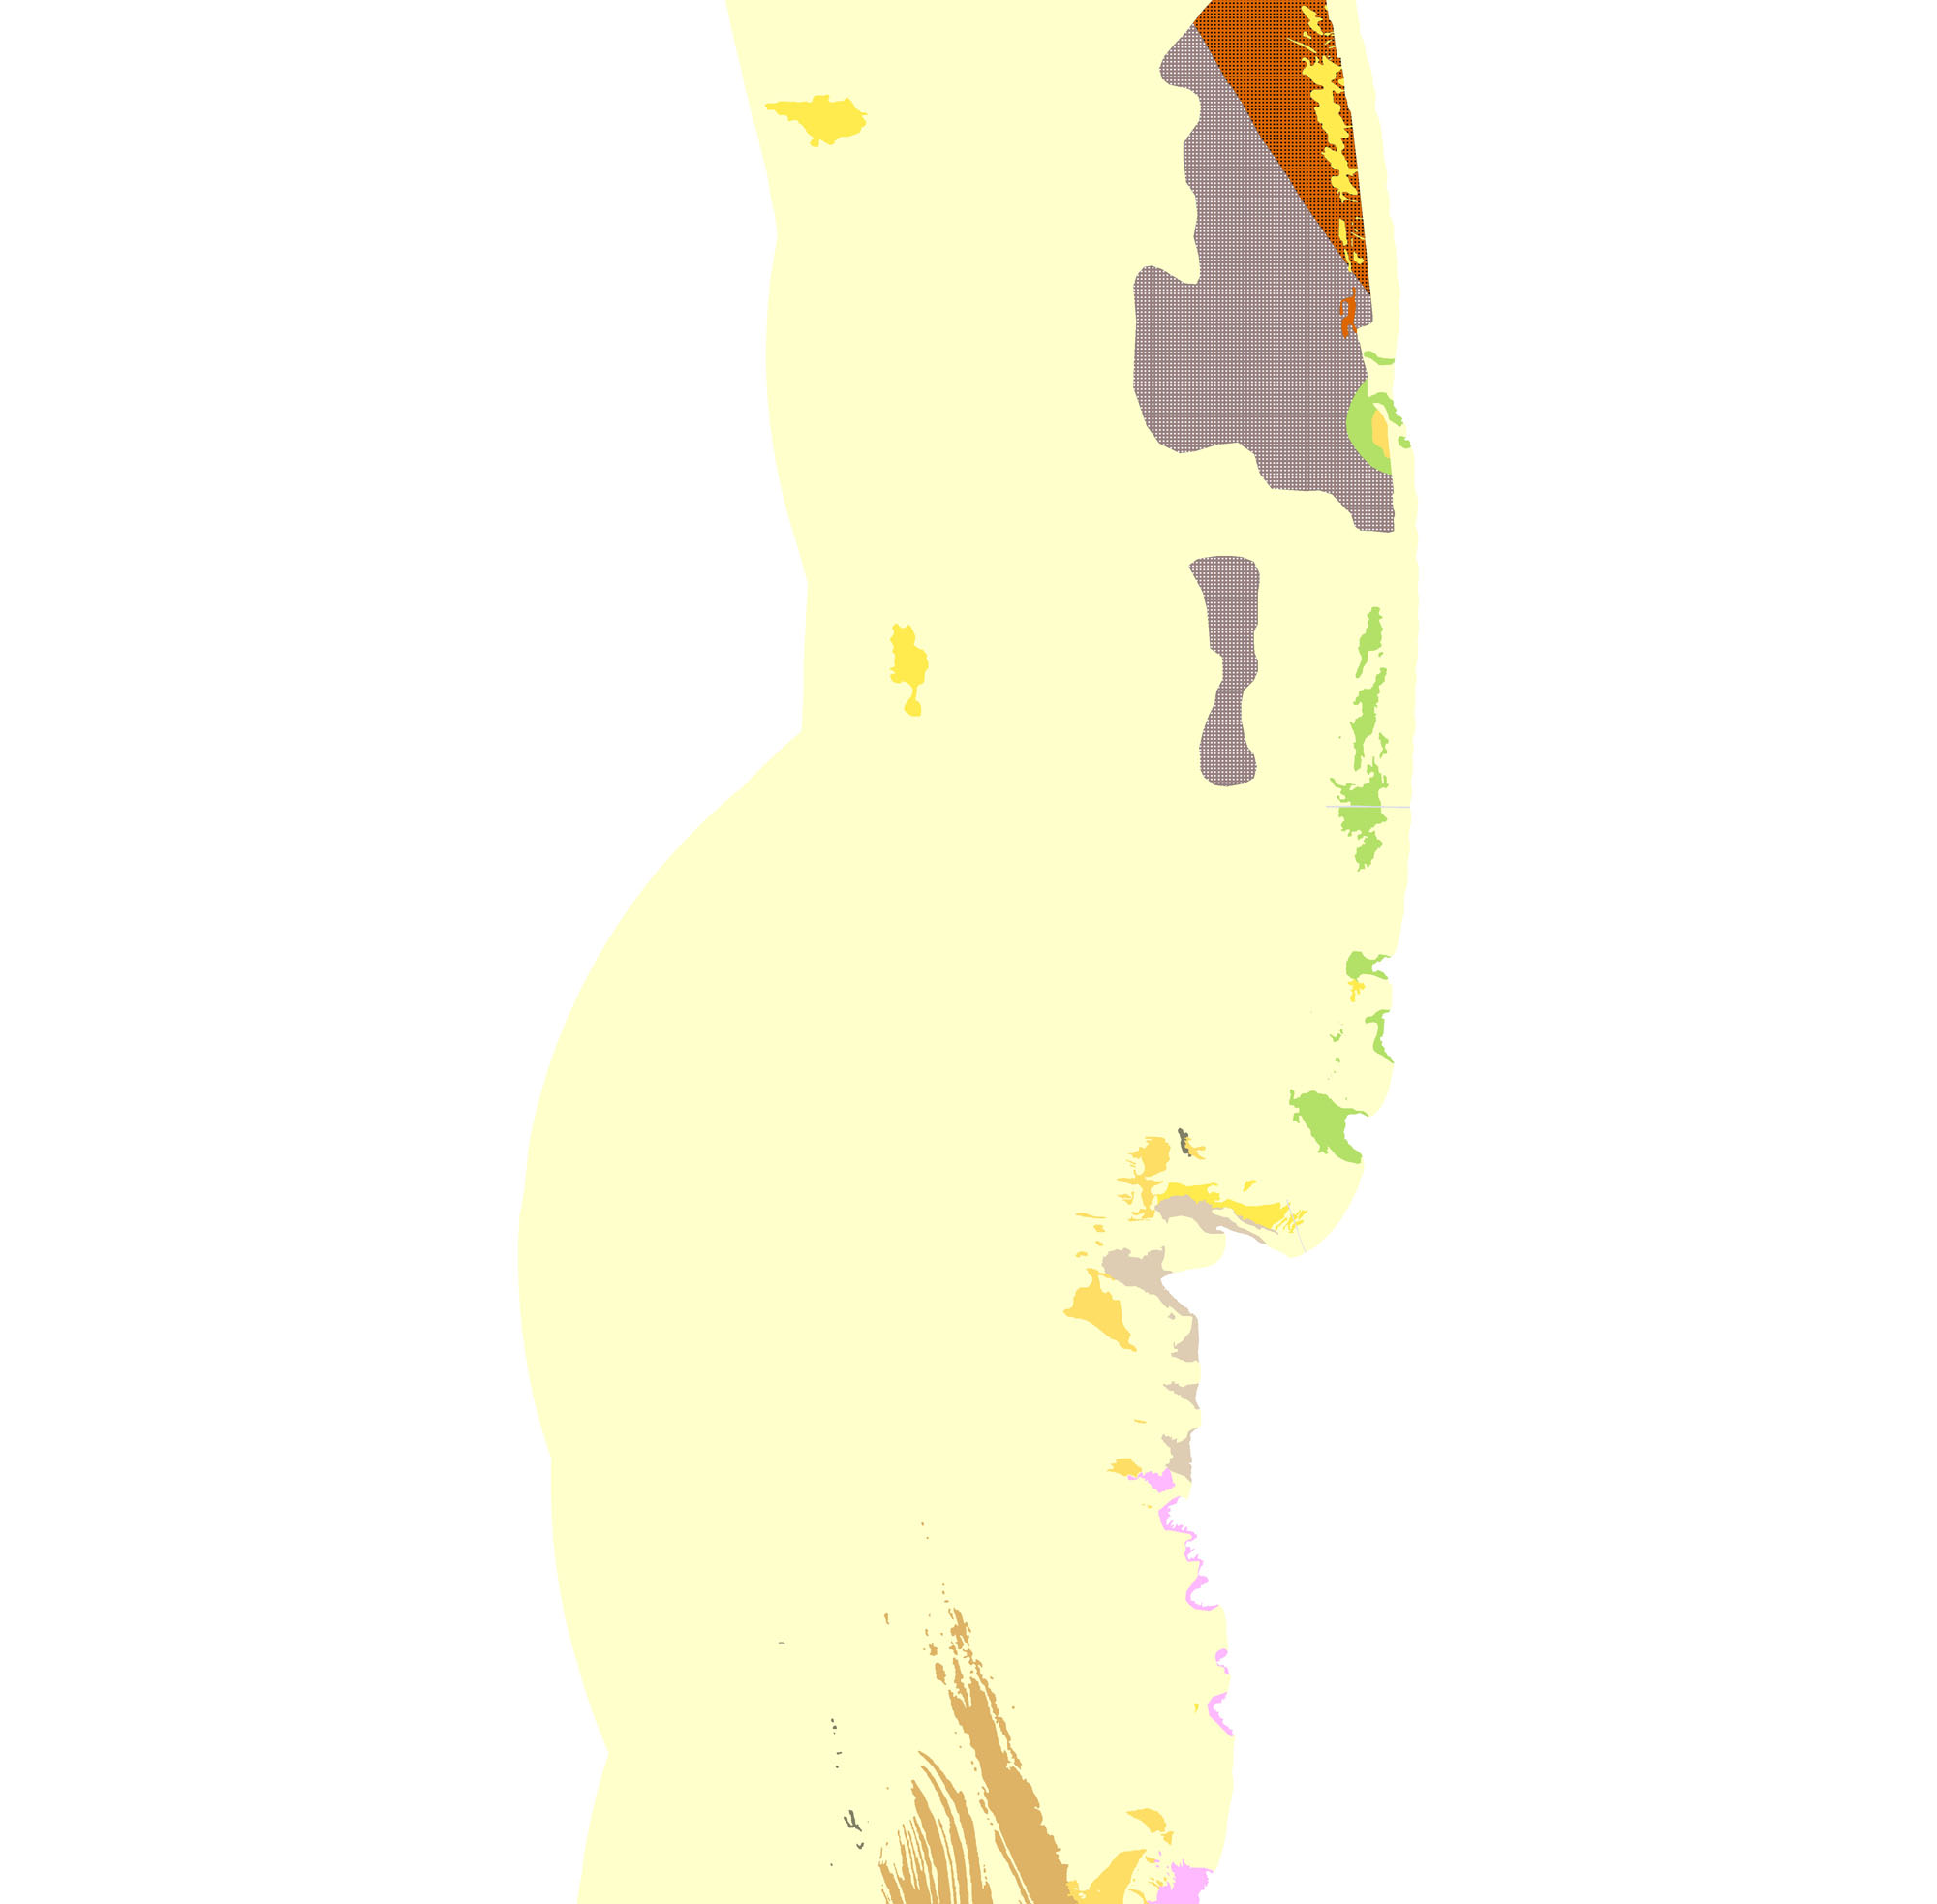
    MapUnitAbbrev
    Map Unit abbreviation (Source: This report)

    ValueDefinition
    afArtificial fill and anthropogenic material
    QmsMarine nearshore and shelf deposits
    QmssMarine shelf scour depressions
    QmscCoarse-grained marine nearshore and shelf deposits
    Qms/KJfSediment-covered Franciscan complex
    TpPurisima Formation
    TssUnnamed sandstone, shale, and congomerate
    TKuUndifferentiated sedimentary deposits
    KgrGranite
    Kgr?Granite (questionable)
    KJfFranciscan complex

    Shape_Area
    Area of feature in internal units squared. (Source: ESRI)

    Positive real numbers that are automatically generated.


Who produced the data set?

  1. Who are the originators of the data set? (may include formal authors, digital compilers, and editors)

  2. Who also contributed to the data set?

  3. To whom should users address questions about the data?

    USGS Pacific Coastal and Marine Science Center
    Attn: Stephen Hartwell
    Geologist
    400 Natural Bridges Drive
    Santa Cruz, CA 95060
    USA

    (831) 460-7814 (voice)
    (831) 427-4748 (FAX)
    shartwell@usgs.gov


Why was the data set created?

To expand geologic mapping to the seafloor within the California's State Waters, to update coastal geologic mapping, and to contribute to a uniform regional geologic database, which can be used geographic information systems. Additionally, to provide a geologic map for the public and geoscience community to aid in assessments and mitigation of geologic hazards in the San Gregorio coastal region and to provide sufficient geologic information for land-use and land-management decisions both onshore and offshore. This information is not intended for navigational purposes.


How was the data set created?

  1. From what previous works were the data drawn?

    DS 781 (source 1 of 3)
    Bretz, Carrie K., Kvitek, Rikk G., Dartnell, Peter, and Phillips, Eleyne L., 2014, Bathymetry--Offshore of Pacifica map area, California: Data Series DS 781, U.S. Geological Survey, Reston, VA.

    Online Links:

    Other_Citation_Details:
    See metadata for bathymetry ("Bathymetry_OffshorePacifica_metadata.txt") in DS 781 for source data and postprocessing/reprocessing information.
    Type_of_Source_Media: digital file of gridded bathymetry data (ArcInfo GRID)
    Source_Contribution: Gridded bathymetry data (2-meter resolution).

    DS 781 (source 2 of 3)
    Bretz, Carrie K., Kvitek, Rikk G., Dartnell, Peter, and Phillips, Eleyne L., 2013, Backscatter--Offshore of Pacifica map area, California: Data Series DS 781, U.S. Geological Survey, Reston, VA.

    Online Links:

    Other_Citation_Details:
    See metadata for bathymetry ("BackscatterA_8101_OffshorePacifica_metadata.txt" and "BackscatterB_7125_OffshorePacifica_metadata.txt") in DS 781 for amplitude source data and postprocessing/reprocessing information.
    Type_of_Source_Media: digital file of gridded amplitude data (ArcInfo GRID)
    Source_Contribution: Gridded amplitude data (2-meter resolution).

    S-15-10-NC (source 3 of 3)
    U.S. Geological Survey (USGS) , Coastal and Marine Geology Program (CMGP), 2013, Seismic-reflection data acquisition data of field activity S-15-10-NC in offshore Pescadero from 08/02/2010 to 08/04/2010: U.S. Geological Survey (USGS) , Coastal and Marine Geology (CMG), Menlo Park, CA.

    Online Links:

    Type_of_Source_Media: ASCII lat/long shot point files
    Source_Contribution:
    Digital seismic data used to interpret subsurface geologic structure

  2. How were the data generated, processed, and modified?

    Date: 2012 (process 1 of 3)
    Faults were mapped onto shot lines based on the latitude and longitude of seismic picks from field activity S-15-10-NC.

    Date: 2012 (process 2 of 3)
    Map unit polygons were digitized over underlying 2-meter base layers developed from multibeam bathymetry and backscatter data. Derivatives such as slope and curvature were generated from source rasters. Interpreted rasters include amplitude, hillshaded bathymetry (using various illumination angles and vertical exaggeration), slope, and curvature. Curvature was decomposed into profile and plan curvature for analysis purposes.

    Date: 2011 (process 3 of 3)
    The mapped area was extended to the shoreline by using digital orthophotos to interpret the region between the inner edge of the multibeam bathymetry and the approximate shoreline. The approximate shoreline was generated at the NAVD88 +1.46 m contour, defined as the operational MHW shoreline by Weber and others (2005). The resulting boundary was transformed to WGS 84 UTM Zone 10 North in ArcGIS 10 using the NAD83 to WGS84 (ITRF00) transformation algorithm. This boundary was then used to extend and trim both onshore and offshore geology in the print and PDF product. The transformed boundary is contained within the WGS84 "contours" feature class and identified as a water boundary in the associated representation rules.
    Only data for offshore map units are released digitally in this publication. For onshore geology, see Brabb and others (1998) and Witter and others (2006). References Cited:
    Brabb, E.E., Graymer, R.W., and Jones, D.L., 1998, Geology of the Onshore Part of San Mateo County, California: A Digital Database: U.S. Geological Survey Open-File Report 98-137, scale 1:62,500.
    Weber, K.M., List, J.H., and Morgan, K.L., 2005, An operational Mean High Water datum for determination of shoreline position from topographic lidar data: U.S. Geological Survey Open-File Report 2005-1027, available at <https://pubs.usgs.gov/of/2005/1027/>.
    Witter, R.C., Knudsen, K.L., Sowers, J.M., Wentworth, C.M., Koehler, R.D., Randolph, C.E., Brooks, S.K., and Gans, K.D., 2006, Maps of Quaternary Deposits and Liquefaction Susceptibility in the Central San Francisco Bay Region, California, U.S. Geological Survey Open-File Report 06-1037, scale 1:24,000.

  3. What similar or related data should the user be aware of?


How reliable are the data; what problems remain in the data set?

  1. How well have the observations been checked?

  2. How accurate are the geographic locations?

    Polygons were primarily mapped by one of the following methods: (1) interpretation of 2-meter-resolution hillshaded bathymetry data from bathymetric lidar and sonar surveys (see Bathymetry--Offshore of Pacifica map area, California, DS 781); (2) interpretation of 2-meter-resolution amplitude (backscatter) data from bathymetric sonar surveys (see Backscatter--Offshore of Pacifica map area, California, DS 781); (3) interpretation of 2-meter interpretation of seismic-reflection-profile data (see S-15-10-NC).
    Map Unit contact locations were interpreted typically at a scale of between 1:1,000 and 1:2,000 using the above base data. Bathymetric sonar and LiDAR data have a horizontal accuracy greater than the resolution of the base data.
    Map unit contacts were digitized by heads-up screen digitization of line data on 2-meter-resolution DEMs described above. Horizontal accuracy is estimated to be between 2 and 5 meters depending on how clearly contacts can be resolved.
    Most digitized positions on the map are estimated to have better than 5 m horizontal accuracy. There is no elevation data in the database.

  3. How accurate are the heights or depths?

  4. Where are the gaps in the data? What is missing?

    Data are complete: no offshore features that could be accurately identified and represented at the compilation scale of 1:24,000 were eliminated or generalized. The smallest area represented is approximately 100 square meters. All geospatial database elements are attributed.

  5. How consistent are the relationships among the observations, including topology?

    Map elements were visually checked for overshoots, undershoots, duplicate features, polygon closure, and other errors by the lead authors and by the GIS technician(s) who created the digital database. Review drafts of the map were reviewed internally by at least two other geologists for consistency with basic geologic principles and general conformity to USGS mapping standards.


How can someone get a copy of the data set?

Are there legal restrictions on access or use of the data?

Access_Constraints:
If physical samples or materials are available, constraints on their on-site access are described in "WR CMG Sample Distribution Policy" at URL: <http://walrus.wr.usgs.gov/infobank/programs/html/main/sample-dist-policy.html>
Use_Constraints:
This information is not intended for navigational purposes.
Read and fully comprehend the metadata prior to data use. Uses of these data should not violate the spatial resolution of the data. Where these data are used in combination with other data of different resolution, the resolution of the combined output will be limited by the lowest resolution of all the data.
Acknowledge the U.S. Geological Survey in products derived from these data. Share data products developed using these data with the U.S. Geological Survey.
This database has been approved for release and publication by the Director of the USGS. Although this database has been subjected to rigorous review and is substantially complete, the USGS reserves the right to revise the data pursuant to further analysis and review. Furthermore, it is released on condition that neither the USGS nor the United States Government may be held liable for any damages resulting from its authorized or unauthorized use.
Although this Federal Geographic Data Committee-compliant metadata file is intended to document these data in nonproprietary form, as well as in ArcInfo format, this metadata file may include some ArcInfo-specific terminology.


Who wrote the metadata?

Dates:
Last modified: 2013
Metadata author:
U.S. Geological Survey, Coastal and Marine Geology Program
Attn: Stephen R. Hartwell
400 Natural Bridges Drive
Santa Cruz, CA 95060-5792
US

831-460-7814 (voice)
831-427-4748 (FAX)
shartwell@usgs.gov

Metadata standard:
FGDC Content Standard for Digital Geospatial Metadata (FGDC-STD-001-1998)


Generated by mp version 2.9.16 on Wed Jan 21 09:59:49 2015