Online Links:
Online Links:
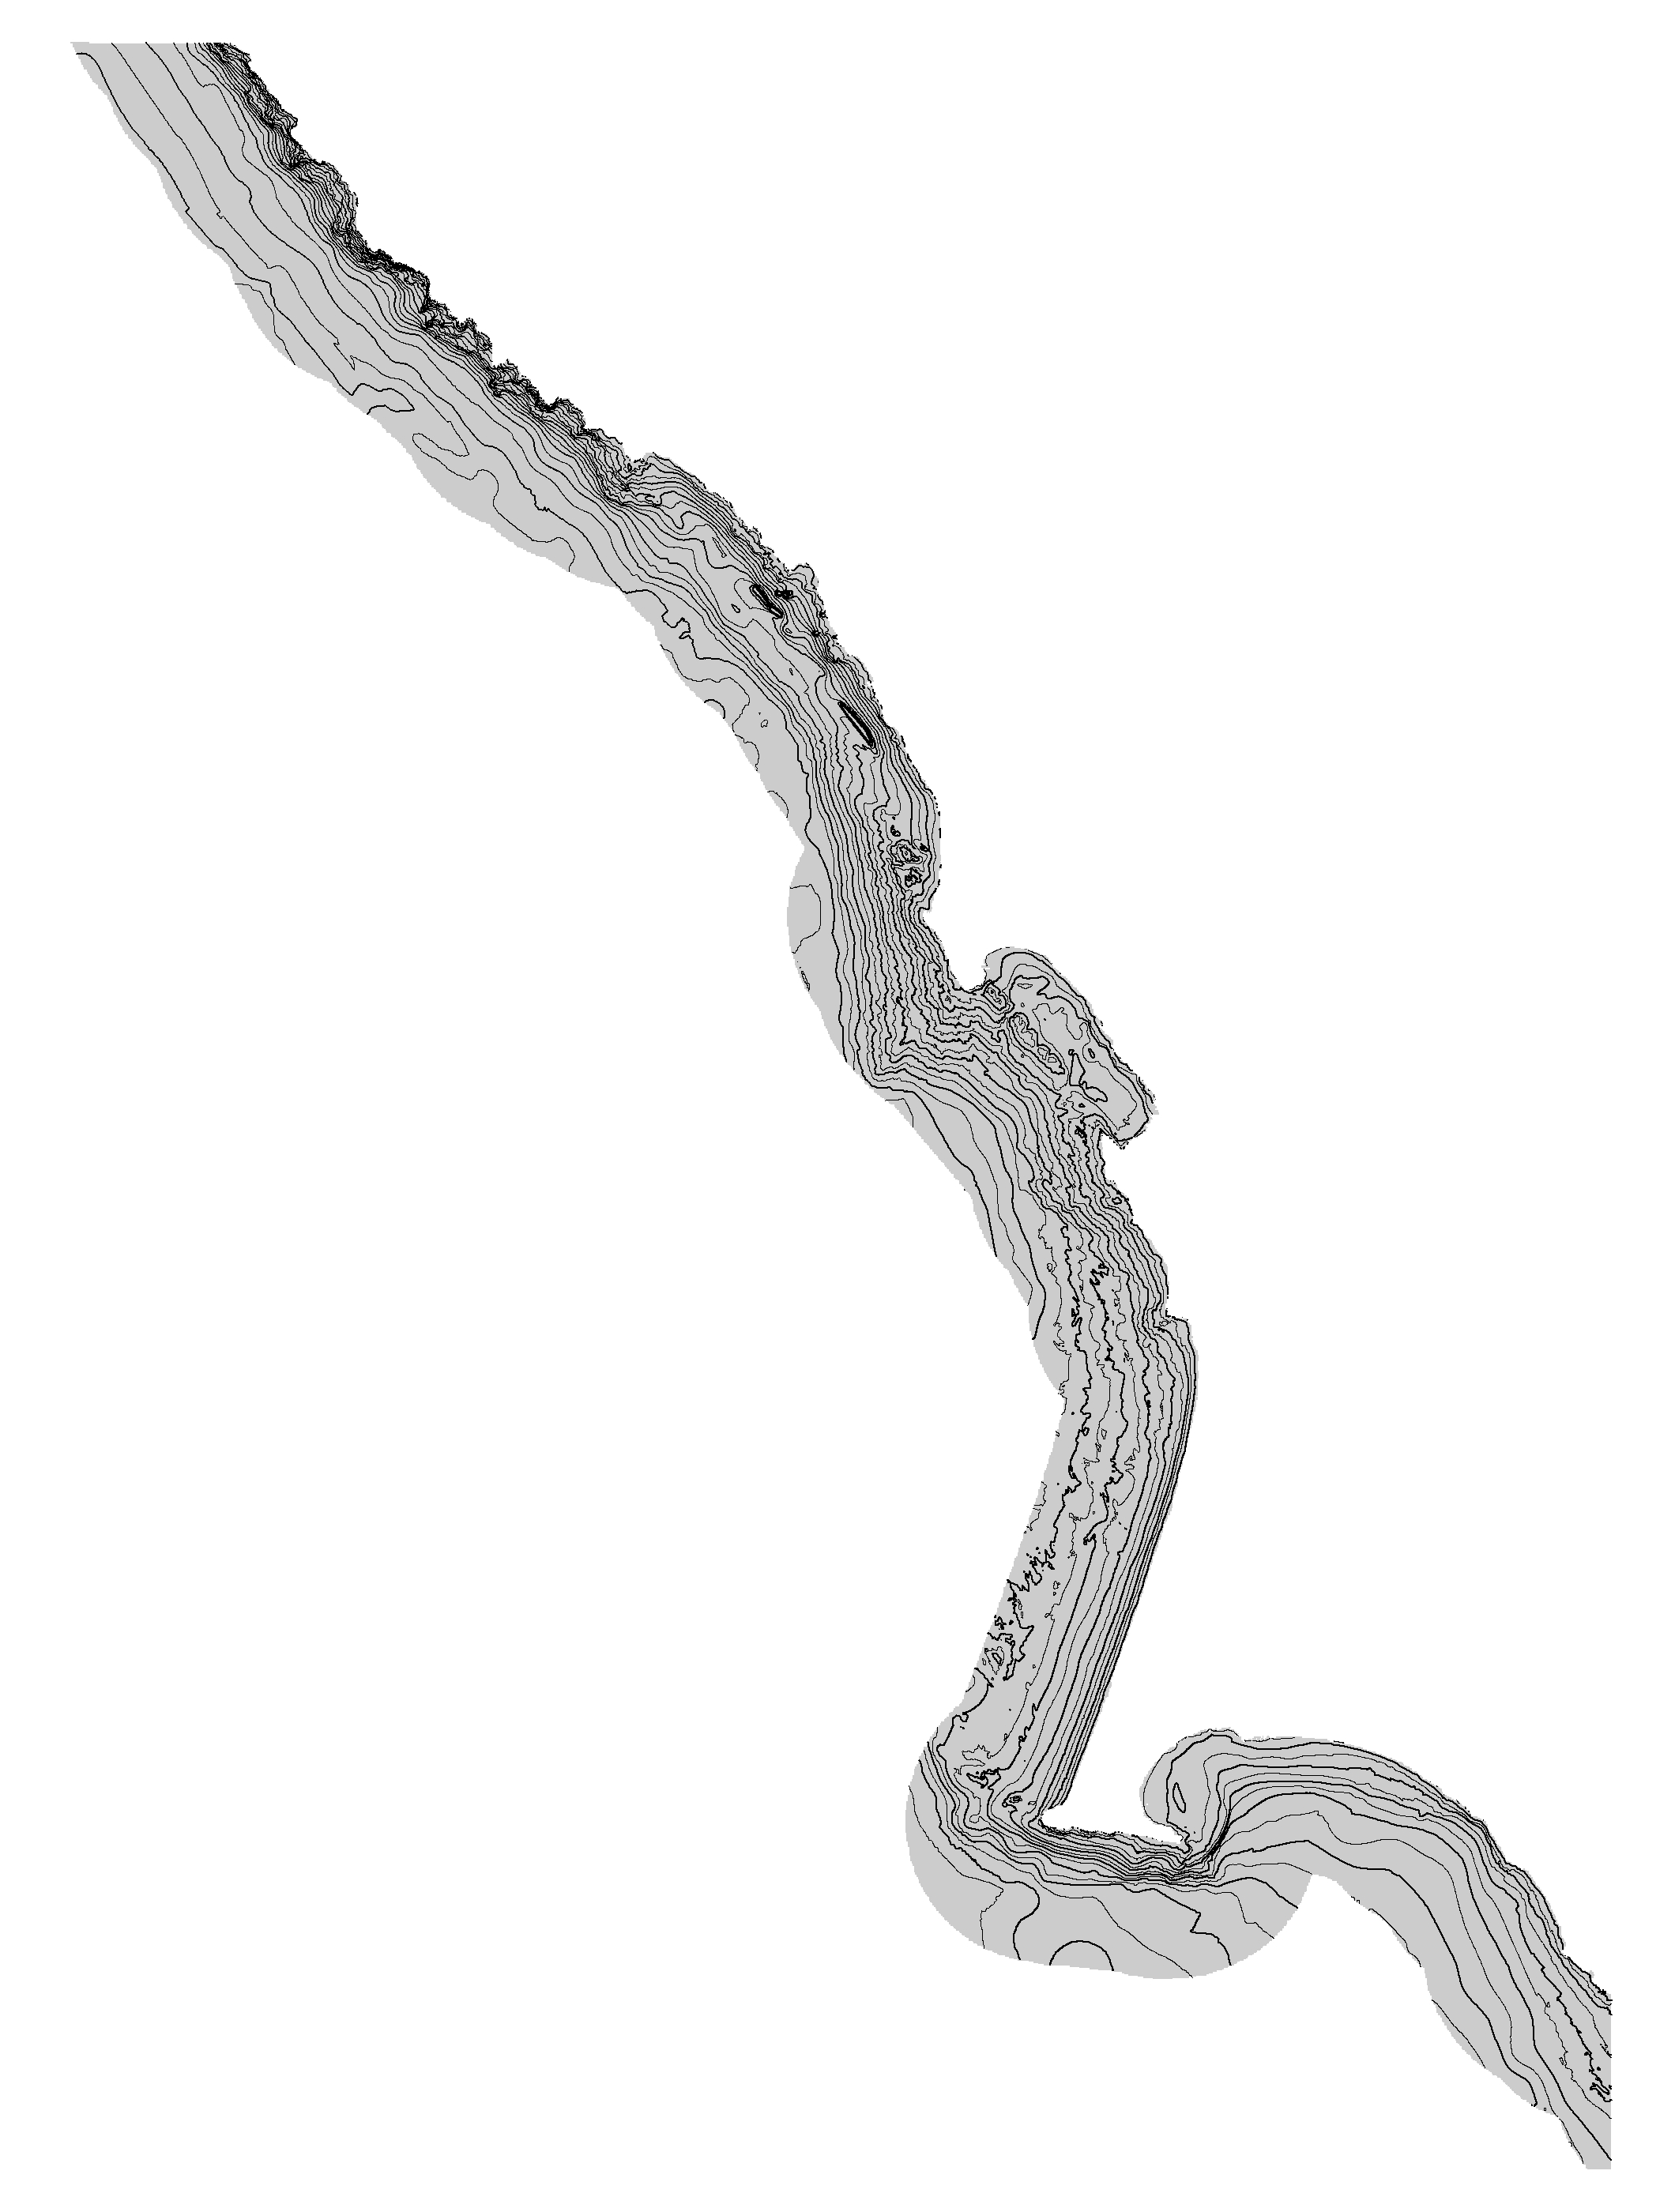
| Value | Definition |
|---|---|
| Index | Contour at 10m interval |
| Intermediate | Contours at 5m interval |
Online Links:
| Access_Constraints | No access constraints |
|---|---|
| Use_Constraints | USGS-authored or produced data and information are in the public domain from the U.S. Government and are freely redistributable with proper metadata and source attribution. Please recognize and acknowledge the U.S. Geological Survey and California State University, Monterey Bay, Seafloor Mapping Lab (CSUMB) as the originator(s) of the dataset and in products derived from these data. This information is not intended for navigation purposes. |
| Data format: | File TransgressiveContours_SaltPointToDrakesBay.zip contains ESRI Shapefile, TransgressiveContours_SaltPointToDrakesBay, with associated files created by ArcGIS. in format shapefile Size: 3.9 |
|---|---|
| Network links: |
https://pubs.usgs.gov/ds/781/SaltPointToDrakesBay/data/TransgressiveContours_SaltPointToDrakesBay.zip https://pubs.usgs.gov/ds/781/BolinasToPescadero/data_catalog_BolinasToPescadero.html https://pubs.usgs.gov/ds/781/ |