Data Series 812
Red Sheep CreekGTN-P code: U36 Latitude: 68° 40.898′N Longitude: 144° 50.524′W Elevation: 785 meters above mean sea level Installation date: 03 AUG 2004 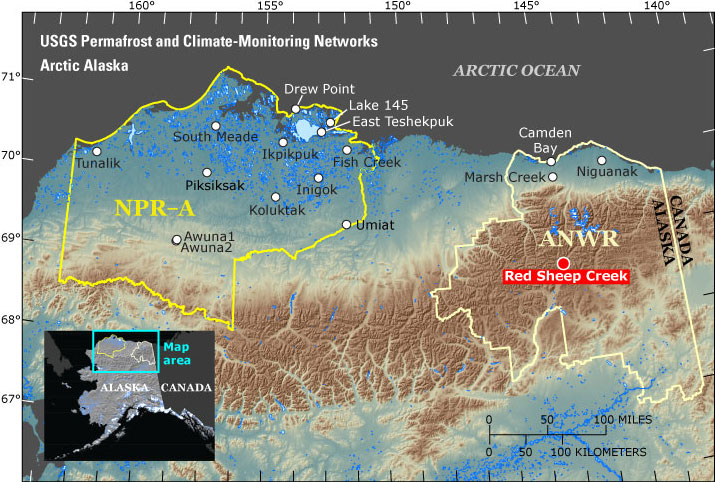
Figure 1. Location map presenting the specific location of the Red Sheep Creek site and its spatial relationship to other sites in the monitoring network. (NPR-A, National Petroleum Reserve–Alaska; ANWR, Arctic National Wildlife Refuge) 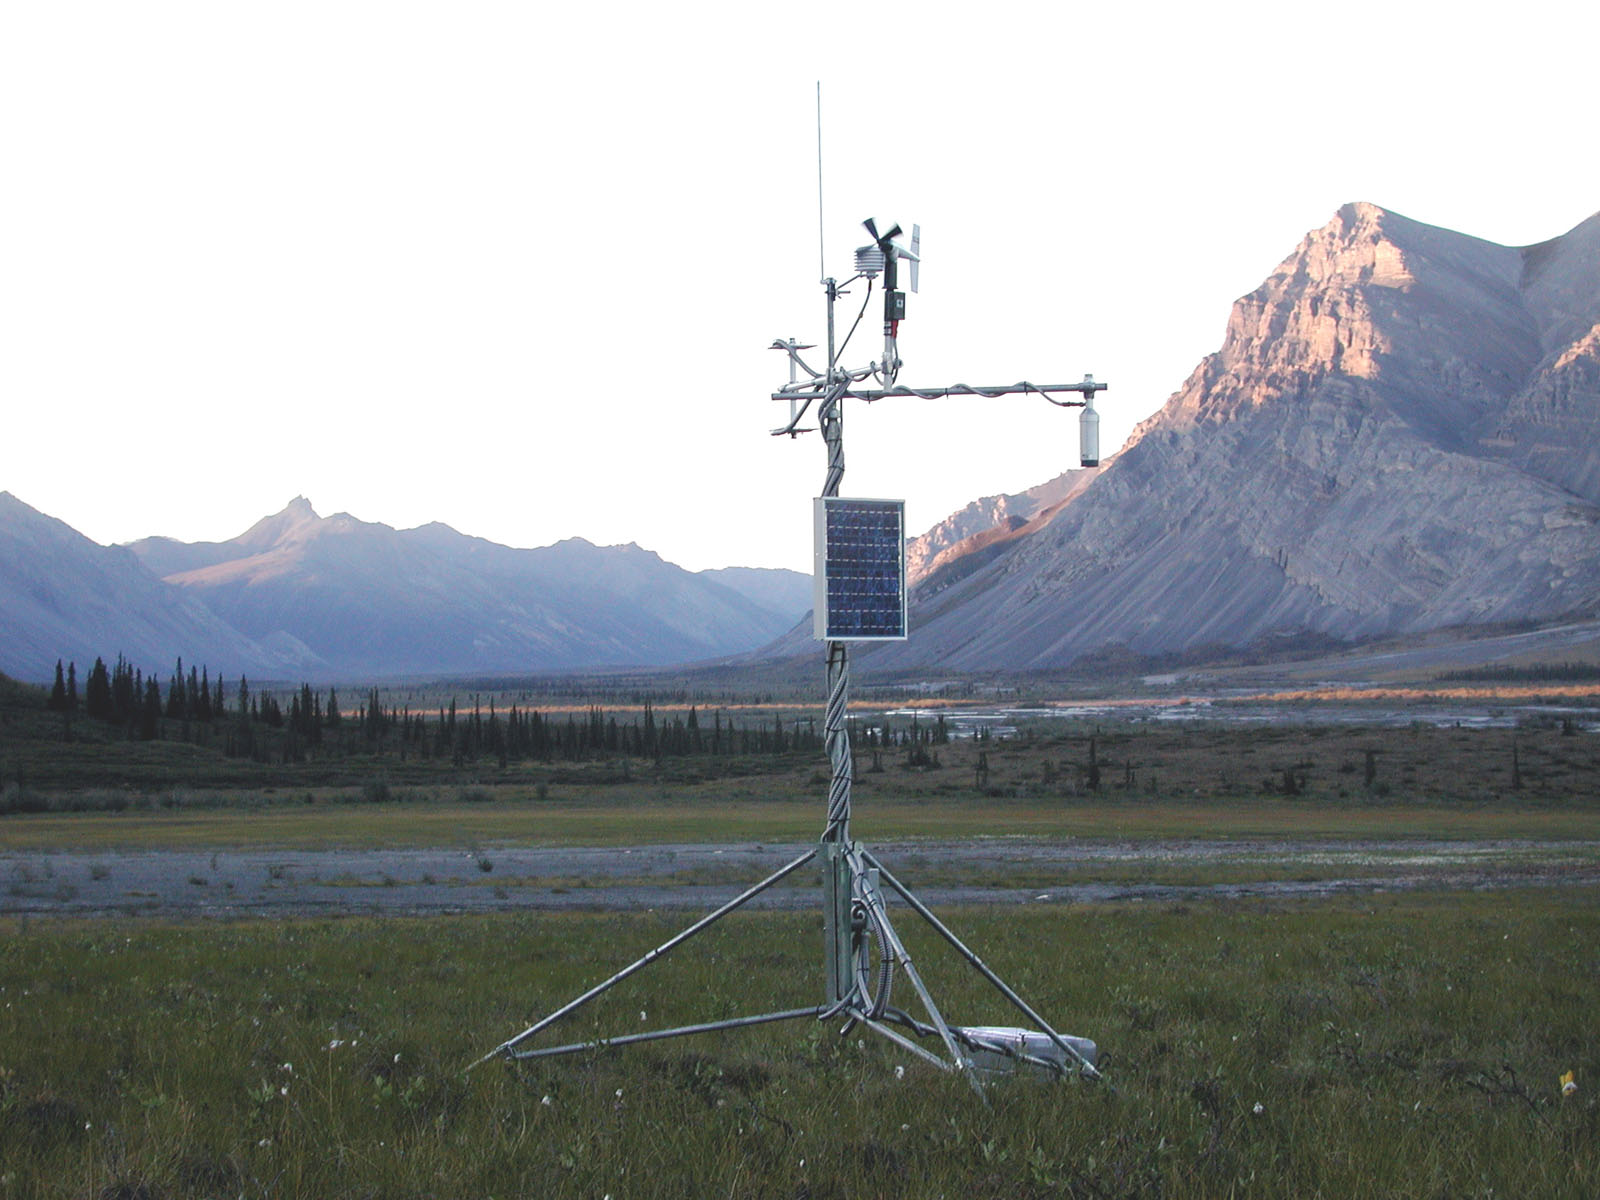
Figure 2. Red Sheep Creek station in summer 2005. (Click image for larger version.) 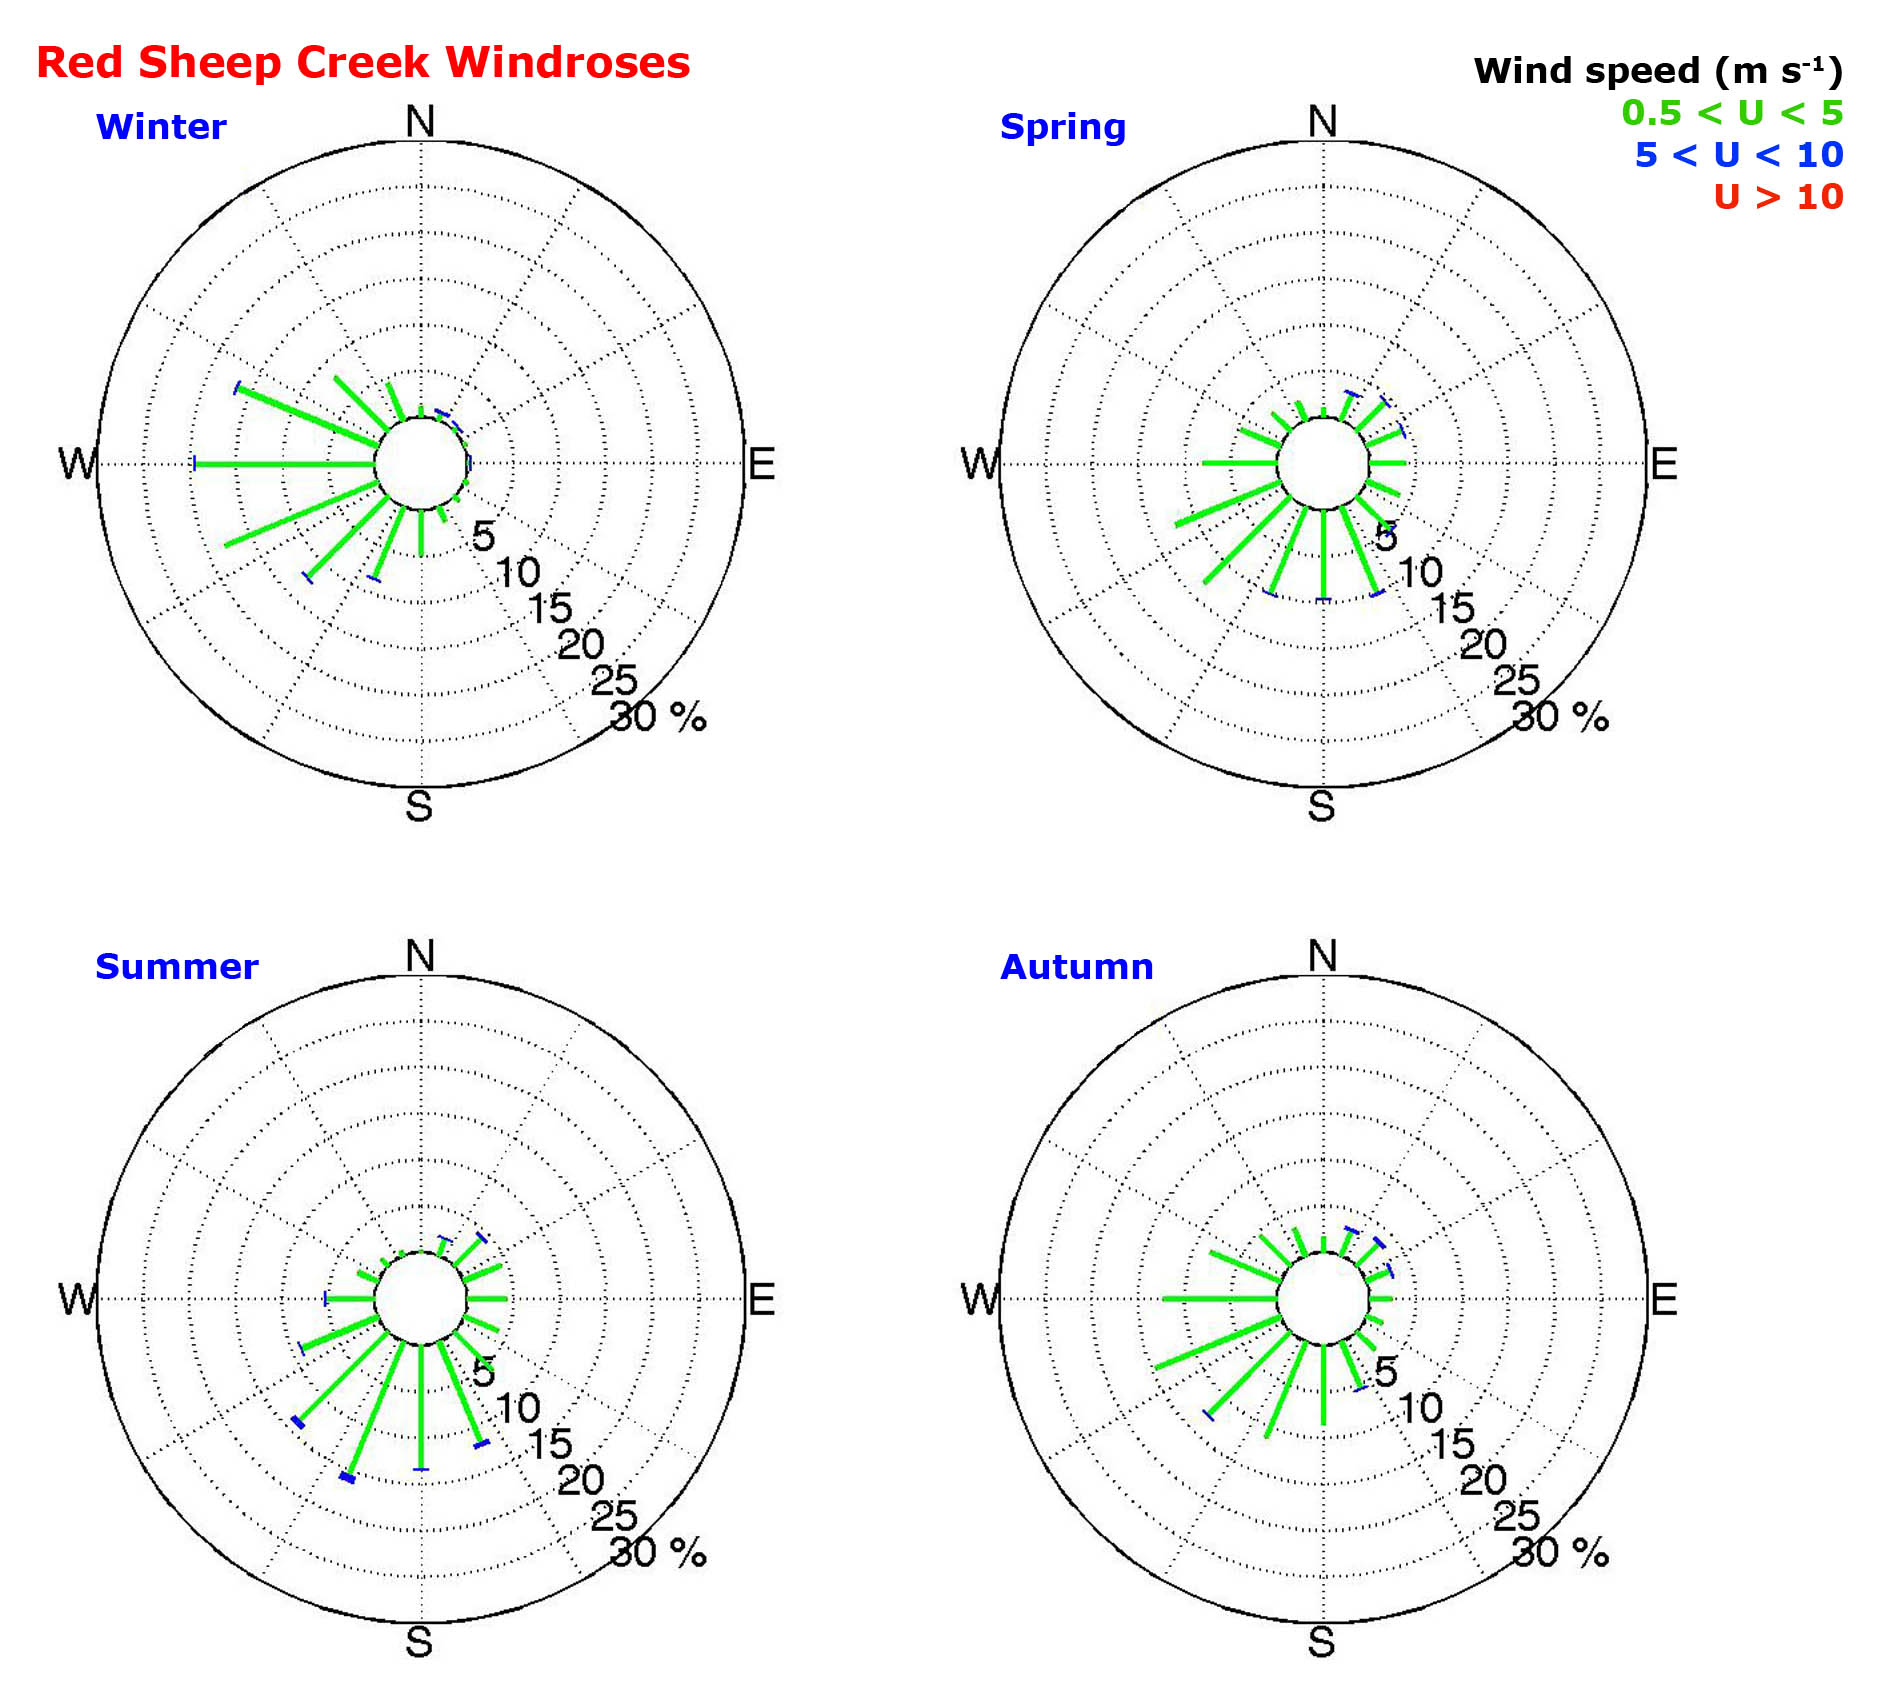
Figure 3. Red Sheep Creek: Seasonal windroses. The wind direction and speed data are divided into 16 wind direction categories (22.5° each) and 3 wind speed classes: less than 5 m s−1, between Data Access (Large file will open in new window)TablesTable 1a. Statistical summaries of air temperature data at monthly resolution. Average, minimum, maximum, anomaly, and percentage of data available. Anomalies are calculated relative to the entire available period of record for the given site. 95 percent of the data must be available in order to calculate statistics. Periods with less than the 95 percent requirement are represented by NaN (not a number). Site name: Red Sheep Creek Variable: Air temperature, in degrees Celsius File name: AK112_Tair_mon_stats.txt Date of file preparation: 31 Oct 2013 Name of file preparer: Frank Urban Monthly Averages: Year JAN FEB MAR APR MAY JUN JUL AUG SEP OCT NOV DEC 2004 NaN NaN NaN NaN NaN NaN NaN NaN -2.33 -11.58 -20.69 -22.02 2005 -21.27 -21.54 -14.65 -7.94 6.81 12.71 11.15 10.30 1.63 -9.15 -21.63 -16.66 2006 -26.27 -18.25 -21.19 -11.07 3.25 10.46 11.65 8.39 5.39 -7.21 -21.88 -16.76 2007 -20.46 -23.72 -24.40 -6.56 2.23 13.33 15.13 10.74 1.78 -11.16 -13.91 -19.88 2008 -25.16 -21.69 -18.37 -8.05 2.94 12.23 11.54 7.07 0.49 -15.11 -16.91 -22.60 2009 -24.18 -22.74 -23.72 -9.85 NaN NaN NaN NaN NaN NaN NaN NaN 2010 NaN NaN NaN NaN NaN NaN NaN NaN 2.50 -8.47 -14.06 -26.01 2011 -19.83 -23.33 -18.18 -11.88 NaN NaN NaN Minimum Value Each Month: Year JAN FEB MAR APR MAY JUN JUL AUG SEP OCT NOV DEC 2004 NaN NaN NaN NaN NaN NaN NaN NaN -15.75 -24.71 -34.74 -36.33 2005 -35.56 -34.89 -26.03 -25.28 -6.26 0.82 0.57 -2.05 -11.45 -22.95 -33.72 -34.64 2006 -39.26 -39.17 -36.66 -26.37 -14.23 -9.23 4.17 -1.12 -2.31 -21.09 -29.58 -33.18 2007 -36.77 -40.41 -38.79 -19.80 -16.58 3.11 6.43 0.40 -11.68 -23.18 -23.10 -35.82 2008 -39.42 -36.80 -33.88 -23.42 -6.26 0.52 2.01 -2.37 -12.90 -30.03 -31.68 -34.74 2009 -38.04 -37.39 -34.69 -28.48 NaN NaN NaN NaN NaN NaN NaN NaN 2010 NaN NaN NaN NaN NaN NaN NaN NaN -14.87 -20.31 -34.00 -35.82 2011 -37.39 -37.86 -30.89 -27.10 NaN NaN NaN Maximum Value Each Month: Year JAN FEB MAR APR MAY JUN JUL AUG SEP OCT NOV DEC 2004 NaN NaN NaN NaN NaN NaN NaN NaN 10.15 2.42 -7.93 -7.19 2005 -1.27 -9.42 -5.91 14.13 16.72 24.49 21.59 24.96 9.35 3.19 -2.80 -3.14 2006 -12.70 0.88 -3.84 0.39 13.66 21.01 20.38 19.23 16.10 2.68 -11.87 -4.75 2007 -7.00 -3.43 -4.68 6.06 15.53 23.91 23.52 19.23 14.77 0.99 -1.22 -7.98 2008 -7.11 -0.53 -2.81 3.70 15.42 23.82 21.36 16.41 14.69 0.55 -6.51 -4.03 2009 1.02 -8.22 -6.29 12.19 NaN NaN NaN NaN NaN NaN NaN NaN 2010 NaN NaN NaN NaN NaN NaN NaN NaN 14.56 6.31 -1.51 -9.53 2011 1.06 -5.57 0.88 2.55 NaN NaN NaN Anomaly Relative to the Climatological Mean: Year JAN FEB MAR APR MAY JUN JUL AUG SEP OCT NOV DEC 2004 NaN NaN NaN NaN NaN NaN NaN NaN -4.10 -1.44 -1.67 -1.48 2005 2.18 -0.26 5.83 0.89 3.30 0.27 -1.38 NaN -0.14 0.99 -2.62 3.88 2006 -2.82 3.02 -0.71 -2.24 -0.27 -1.99 -0.89 NaN 3.62 2.93 -2.87 3.78 2007 2.99 -2.44 -3.92 2.27 -1.29 0.89 2.59 NaN 0.01 -1.01 5.10 0.66 2008 -1.71 -0.41 2.11 0.78 -0.57 -0.21 -0.99 NaN -1.28 -4.97 2.10 -2.05 2009 -0.73 -1.47 -3.24 -1.02 NaN NaN NaN NaN NaN NaN NaN NaN 2010 NaN NaN NaN NaN NaN NaN NaN NaN 0.73 1.68 4.95 -5.47 2011 3.62 -2.05 2.30 -3.05 NaN NaN NaN Percent of Data Available during Each Month: Year JAN FEB MAR APR MAY JUN JUL AUG SEP OCT NOV DEC 2004 0.00 0.00 0.00 0.00 0.00 0.00 0.00 0.00 100.00 100.00 100.00 100.00 2005 100.00 100.00 100.00 100.00 100.00 100.00 100.00 100.00 100.00 100.00 100.00 100.00 2006 100.00 100.00 100.00 100.00 100.00 100.00 100.00 99.60 100.00 100.00 100.00 100.00 2007 100.00 100.00 100.00 100.00 100.00 100.00 100.00 100.00 100.00 100.00 100.00 100.00 2008 100.00 100.00 100.00 100.00 100.00 100.00 100.00 100.00 100.00 100.00 100.00 100.00 2009 100.00 100.00 100.00 100.00 84.01 0.00 0.00 0.00 0.00 0.00 0.00 0.00 2010 0.00 0.00 0.00 0.00 0.00 0.00 0.00 39.78 100.00 100.00 100.00 100.00 2011 100.00 100.00 100.00 100.00 63.17 0.00 0.00 Table 1b. Statistical summaries of wind speed data at monthly resolution. Average, maximum, and percentage of data available. 95 percent of the data must be available in order to calculate statistics. Periods with less than the 95 percent requirement are represented by NaN (not a number). Site name: Red Sheep Creek Variable: Wind speed, in meters per second File name: AK112_U_mon_stats.txt Date of file preparation: 05 Jul 2013 Name of file preparer: Frank Urban Monthly Averages: Year JAN FEB MAR APR MAY JUN JUL AUG SEP OCT NOV DEC 2004 NaN NaN NaN NaN NaN NaN NaN NaN NaN 0.70 0.64 0.98 2005 1.00 NaN 1.42 1.05 1.95 2.44 2.57 1.98 1.73 1.13 1.39 NaN 2006 0.51 1.14 0.79 1.33 1.92 2.70 2.40 1.83 1.26 1.11 0.98 0.93 2007 0.79 0.75 0.91 1.19 1.63 2.27 2.01 1.73 1.60 1.11 0.94 0.84 2008 1.10 1.07 1.19 1.31 2.25 2.19 1.96 1.82 1.41 1.11 1.09 0.81 2009 0.91 NaN 0.90 0.85 2.09 2.16 1.94 1.90 1.38 1.13 0.71 1.06 2010 NaN 1.10 1.28 1.40 2.30 2.26 2.17 1.62 1.32 1.19 NaN NaN 2011 0.90 1.03 0.60 1.29 NaN NaN NaN Maximum Value Each Month: Year JAN FEB MAR APR MAY JUN JUL AUG SEP OCT NOV DEC 2004 NaN NaN NaN NaN NaN NaN NaN NaN NaN 4.39 5.63 6.37 2005 6.72 NaN 8.77 5.60 5.25 6.06 6.79 6.19 5.88 5.36 7.16 NaN 2006 6.40 6.80 5.51 6.50 5.85 7.99 7.21 7.03 4.95 6.04 8.45 5.95 2007 5.69 5.13 5.11 6.48 7.28 6.08 7.94 5.57 5.52 4.55 6.37 6.85 2008 8.95 6.47 7.16 6.65 6.54 6.11 5.85 4.80 4.56 6.71 5.78 5.27 2009 8.41 NaN 5.41 5.02 5.32 5.71 6.64 5.53 4.59 5.98 5.06 6.13 2010 NaN 6.24 7.21 5.57 6.10 6.39 6.14 5.21 5.93 5.47 NaN NaN 2011 7.85 9.68 3.93 8.17 NaN NaN NaN Anomaly Relative to the Climatological Mean: Year JAN FEB MAR APR MAY JUN JUL AUG SEP OCT NOV DEC 2004 NaN NaN NaN NaN NaN NaN NaN NaN NaN -0.35 -0.31 0.02 2005 0.04 NaN 0.43 -0.12 -0.04 0.12 0.42 0.17 0.26 0.08 0.43 NaN 2006 -0.45 0.13 -0.19 0.15 -0.08 0.39 0.25 0.02 -0.21 0.07 0.03 -0.03 2007 -0.17 -0.26 -0.08 0.02 -0.37 -0.04 -0.14 -0.08 0.13 0.07 -0.02 -0.12 2008 0.14 0.06 0.20 0.13 0.25 -0.13 -0.19 0.00 -0.06 0.06 0.14 -0.15 2009 -0.04 NaN -0.08 -0.33 0.09 -0.16 -0.21 0.08 -0.09 0.08 -0.24 0.10 2010 NaN 0.09 0.30 0.22 0.30 -0.06 0.02 -0.19 -0.15 0.15 NaN NaN 2011 -0.06 0.02 -0.39 0.11 NaN NaN NaN Percent of Data Available during Each Month: Year JAN FEB MAR APR MAY JUN JUL AUG SEP OCT NOV DEC 2004 0.00 0.00 0.00 0.00 0.00 0.00 0.00 0.00 94.58 96.64 96.25 100.00 2005 100.00 94.94 100.00 100.00 100.00 100.00 100.00 100.00 99.17 100.00 100.00 76.08 2006 100.00 100.00 100.00 100.00 100.00 100.00 100.00 99.60 100.00 98.52 100.00 100.00 2007 100.00 100.00 100.00 100.00 100.00 100.00 100.00 100.00 100.00 100.00 100.00 100.00 2008 100.00 100.00 100.00 100.00 100.00 100.00 100.00 100.00 100.00 100.00 100.00 100.00 2009 100.00 84.97 100.00 100.00 100.00 100.00 100.00 99.73 99.03 100.00 100.00 100.00 2010 93.28 100.00 100.00 100.00 100.00 100.00 100.00 99.87 100.00 100.00 77.92 88.04 2011 100.00 100.00 100.00 100.00 63.17 0.00 0.00 Table 1c. Statistical summaries of ground temperature data at 10 and 120 centimeters depth at monthly resolution. Average, minimum, maximum, anomaly, and percentage of data available. Anomalies are calculated relative to the entire available period of record for the given site. 95 percent of the data must be available in order to calculate statistics. Periods with less than the 95 percent requirement are represented by NaN (not a number). Site name: Red Sheep Creek Variable: Ground temperature, in degrees Celsius File name: AK112_Tg_mon_stats.txt Date of file preparation: 31 Oct 2013 Name of file preparer: Frank Urban Monthly Averages (10 cm depth): Year JAN FEB MAR APR MAY JUN JUL AUG SEP OCT NOV DEC 2004 NaN NaN NaN NaN NaN NaN NaN NaN 0.21 -0.23 -1.01 -2.64 2005 -5.24 -7.43 -7.39 -6.81 0.10 5.61 6.14 4.72 1.60 -1.02 -3.67 -4.07 2006 -8.05 -9.45 -9.66 -8.07 -2.36 3.33 6.06 4.41 1.85 -0.37 -5.57 -8.67 2007 -10.38 -10.64 -12.99 -9.45 NaN NaN NaN NaN NaN NaN NaN NaN 2008 NaN NaN NaN NaN NaN NaN NaN NaN NaN NaN NaN NaN 2009 NaN NaN NaN NaN NaN NaN NaN NaN NaN NaN NaN NaN 2010 NaN NaN NaN NaN NaN NaN NaN NaN 2.98 -2.62 -3.19 -6.32 2011 -10.34 -12.12 -14.07 -10.27 NaN NaN NaN Minimum Value Each Month (10 cm depth): Year JAN FEB MAR APR MAY JUN JUL AUG SEP OCT NOV DEC 2004 NaN NaN NaN NaN NaN NaN NaN NaN -0.05 -0.51 -1.78 -3.67 2005 -6.99 -8.01 -7.79 -7.88 -4.37 0.07 2.42 1.61 -0.05 -2.95 -5.73 -5.16 2006 -11.45 -11.69 -10.56 -9.57 -6.75 -0.05 2.42 1.55 0.06 -1.51 -10.31 -10.55 2007 -12.27 -12.78 -13.43 -12.44 NaN NaN NaN NaN NaN NaN NaN NaN 2008 NaN NaN NaN NaN NaN NaN NaN NaN NaN NaN NaN NaN 2009 NaN NaN NaN NaN NaN NaN NaN NaN NaN NaN NaN NaN 2010 NaN NaN NaN NaN NaN NaN NaN NaN -4.07 -5.88 -5.49 -10.40 2011 -14.69 -13.13 -15.55 -11.65 NaN NaN NaN Maximum Value Each Month (10 cm depth): Year JAN FEB MAR APR MAY JUN JUL AUG SEP OCT NOV DEC 2004 NaN NaN NaN NaN NaN NaN NaN NaN 2.87 0.06 -0.40 -1.46 2005 -3.37 -6.98 -6.90 -4.42 4.19 12.05 9.92 8.61 3.72 0.06 -1.40 -3.06 2006 -5.02 -8.16 -8.71 -6.58 0.95 8.60 11.23 10.35 4.39 0.18 -1.23 -6.53 2007 -8.88 -8.32 -12.40 -7.35 NaN NaN NaN NaN NaN NaN NaN NaN 2008 NaN NaN NaN NaN NaN NaN NaN NaN NaN NaN NaN NaN 2009 NaN NaN NaN NaN NaN NaN NaN NaN NaN NaN NaN NaN 2010 NaN NaN NaN NaN NaN NaN NaN NaN 8.75 0.01 -1.68 -3.00 2011 -6.48 -10.81 -10.81 -7.66 NaN NaN NaN Anomaly Relative to the Climatological Mean (10 cm depth): Year JAN FEB MAR APR MAY JUN JUL AUG SEP OCT NOV DEC 2004 NaN NaN NaN NaN NaN NaN NaN NaN -1.45 0.83 2.35 2.79 2005 3.26 2.48 3.64 1.84 1.23 1.14 0.04 0.16 -0.06 0.04 -0.31 1.36 2006 0.45 0.46 1.37 0.58 -1.23 -1.14 -0.04 -0.16 0.19 0.69 -2.21 -3.25 2007 -1.88 -0.73 -1.97 -0.80 NaN NaN NaN NaN NaN NaN NaN NaN 2008 NaN NaN NaN NaN NaN NaN NaN NaN NaN NaN NaN NaN 2009 NaN NaN NaN NaN NaN NaN NaN NaN NaN NaN NaN NaN 2010 NaN NaN NaN NaN NaN NaN NaN NaN 1.32 -1.56 0.17 -0.90 2011 -1.84 -2.21 -3.04 -1.62 NaN NaN NaN Percent of Data Available during Each Month (10 cm depth): Year JAN FEB MAR APR MAY JUN JUL AUG SEP OCT NOV DEC 2004 0.00 0.00 0.00 0.00 0.00 0.00 0.00 0.00 100.00 100.00 100.00 100.00 2005 100.00 100.00 100.00 100.00 100.00 0.69 0.00 98.12 100.00 100.00 100.00 100.00 2006 100.00 100.00 100.00 100.00 100.00 100.00 100.00 99.60 100.00 100.00 100.00 100.00 2007 100.00 100.00 100.00 100.00 93.95 0.00 0.00 0.00 0.00 0.00 0.00 0.00 2008 0.00 0.00 0.00 0.00 0.00 0.00 0.00 0.00 0.00 0.00 0.00 0.00 2009 0.00 0.00 0.00 0.00 0.00 0.00 0.00 0.00 0.00 0.00 0.00 0.00 2010 0.00 0.00 0.00 0.00 0.00 0.00 0.00 39.65 100.00 100.00 100.00 100.00 2011 100.00 100.00 100.00 100.00 63.17 0.00 0.00 Monthly Averages (120 cm depth): Year JAN FEB MAR APR MAY JUN JUL AUG SEP OCT NOV DEC 2004 NaN NaN NaN NaN NaN NaN NaN NaN -0.84 -0.73 -0.65 -0.77 2005 -2.67 -4.85 -5.67 -5.95 -3.55 -1.68 -1.06 -0.77 -0.61 -0.50 -0.43 -1.25 2006 -3.96 -6.68 -7.29 -7.22 -4.97 -2.16 -1.34 -0.92 -0.68 -0.56 -0.49 -3.70 2007 -6.60 -7.50 -9.47 -9.01 -6.20 -2.72 -1.54 -0.94 -0.69 -0.57 -0.56 -5.16 2008 -8.42 -11.78 -11.60 -10.36 -6.34 -2.82 -1.68 -1.04 -0.79 -0.70 -0.62 -1.15 2009 -4.84 -6.82 -7.43 -7.76 -4.38 -2.01 -1.22 -0.82 -0.65 -0.56 -0.48 -1.60 2010 -5.85 -8.08 -8.39 -7.67 -3.49 -1.81 -1.12 -0.75 -0.59 -0.50 -0.44 -1.82 2011 -5.54 -8.34 -10.08 -9.38 NaN NaN NaN Minimum Value Each Month (120 cm depth): Year JAN FEB MAR APR MAY JUN JUL AUG SEP OCT NOV DEC 2004 NaN NaN NaN NaN NaN NaN NaN NaN -0.95 -0.78 -0.72 -1.44 2005 -3.97 -5.39 -5.91 -6.06 -5.63 -2.20 -1.34 -0.89 -0.72 -0.61 -0.49 -2.36 2006 -6.10 -6.98 -7.66 -7.52 -6.66 -2.94 -1.66 -1.11 -0.78 -0.66 -0.55 -5.34 2007 -7.21 -8.63 -10.02 -10.02 -7.92 -3.87 -1.99 -1.22 -0.83 -0.66 -1.22 -7.29 2008 -10.19 -12.74 -12.09 -11.46 -9.06 -3.81 -2.15 -1.33 -0.89 -0.78 -0.66 -2.78 2009 -6.00 -7.12 -7.96 -8.06 -6.75 -2.78 -1.56 -1.00 -0.78 -0.66 -0.61 -3.61 2010 -7.47 -8.32 -8.71 -8.55 -5.72 -2.37 -1.45 -0.94 -0.67 -0.55 -0.49 -4.12 2011 -7.88 -8.80 -10.77 -10.36 NaN NaN NaN Maximum Value Each Month (120 cm depth): Year JAN FEB MAR APR MAY JUN JUL AUG SEP OCT NOV DEC 2004 NaN NaN NaN NaN NaN NaN NaN NaN -0.72 -0.61 -0.55 -0.55 2005 -1.44 -3.92 -5.34 -5.63 -2.15 -1.28 -0.83 -0.67 -0.55 -0.38 -0.38 -0.38 2006 -2.26 -6.15 -6.71 -6.62 -2.89 -1.61 -1.06 -0.72 -0.61 -0.44 -0.38 -0.49 2007 -5.29 -6.98 -8.66 -7.88 -3.87 -1.94 -1.17 -0.78 -0.61 -0.49 -0.44 -1.22 2008 -7.25 -10.23 -11.30 -9.02 -3.77 -2.10 -1.28 -0.83 -0.72 -0.61 -0.55 -0.50 2009 -2.78 -5.91 -6.98 -6.75 -2.74 -1.50 -0.95 -0.67 -0.55 -0.44 -0.38 -0.38 2010 -3.61 -7.39 -8.14 -5.68 -2.31 -1.39 -0.83 -0.61 -0.49 -0.38 -0.38 -0.38 2011 -4.12 -7.84 -8.80 -8.54 NaN NaN NaN Anomaly Relative to the Climatological Mean (120 cm depth): Year JAN FEB MAR APR MAY JUN JUL AUG SEP OCT NOV DEC 2004 NaN NaN NaN NaN NaN NaN NaN NaN -0.15 -0.14 -0.13 1.44 2005 2.74 2.87 2.89 2.24 1.27 0.52 0.26 0.10 0.08 0.09 0.09 0.96 2006 1.45 1.04 1.27 0.97 -0.15 0.04 -0.01 -0.04 0.01 0.03 0.04 -1.49 2007 -1.19 0.22 -0.91 -0.82 -1.38 -0.52 -0.21 -0.07 0.01 0.02 -0.04 -2.95 2008 -3.01 -4.06 -3.04 -2.16 -1.52 -0.62 -0.35 -0.17 -0.10 -0.11 -0.09 1.06 2009 0.57 0.90 1.13 0.44 0.44 0.19 0.10 0.05 0.05 0.02 0.05 0.61 2010 -0.44 -0.36 0.17 0.53 1.33 0.39 0.21 0.13 0.10 0.09 0.09 0.38 2011 -0.12 -0.62 -1.52 -1.19 NaN NaN NaN Percent of Data Available during Each Month (120 cm depth): Year JAN FEB MAR APR MAY JUN JUL AUG SEP OCT NOV DEC 2004 0.00 0.00 0.00 0.00 0.00 0.00 0.00 0.00 100.00 100.00 100.00 100.00 2005 100.00 100.00 100.00 100.00 100.00 0.69 0.00 98.12 100.00 100.00 100.00 100.00 2006 100.00 100.00 100.00 100.00 100.00 100.00 100.00 99.60 100.00 100.00 100.00 100.00 2007 100.00 100.00 100.00 100.00 93.95 0.00 0.00 0.00 0.00 0.00 0.00 0.00 2008 0.00 0.00 0.00 0.00 0.00 0.00 0.00 0.00 0.00 0.00 0.00 0.00 2009 0.00 0.00 0.00 0.00 0.00 0.00 0.00 0.00 0.00 0.00 0.00 0.00 2010 0.00 0.00 0.00 0.00 0.00 0.00 0.00 39.65 100.00 100.00 100.00 100.00 2011 100.00 100.00 100.00 100.00 63.17 0.00 0.00 Table 1d. Statistical summaries of incident solar flux data at monthly resolution. Average, anomaly, and percentage of data available. 95 percent of the data must be available in order to calculate statistics. Periods with less than the 95 percent requirement are represented by NaN (not a number). Site name: Red Sheep Creek Variable: Incident solar flux, in watts per meter squared File name: AK112_So_d_mon_stats.txt Date of file preparation: 05 Jul 2013 Name of file preparer: Frank Urban Monthly Averages: Year JAN FEB MAR APR MAY JUN JUL AUG SEP OCT NOV DEC 2004 NaN NaN NaN NaN NaN NaN NaN NaN 86.2 25.9 1.0 0.1 2005 1.0 5.8 74.9 188.7 216.6 272.1 211.4 144.2 59.7 25.5 2.3 0.1 2006 0.6 10.3 NaN 179.8 245.1 210.9 207.5 131.9 77.9 21.6 2.1 0.1 2007 0.2 11.8 70.5 178.8 230.0 269.1 219.8 161.7 83.2 24.6 1.6 0.1 2008 0.6 9.5 76.2 155.5 220.2 241.3 185.3 147.2 83.1 20.2 1.2 0.1 2009 1.0 3.9 33.6 168.4 239.8 214.1 198.4 137.8 62.2 22.2 3.0 0.1 2010 0.9 16.4 72.9 164.6 223.7 246.8 187.9 134.0 83.3 26.8 1.7 0.0 2011 1.2 10.9 76.4 152.3 NaN NaN NaN Anomaly Relative to the Climatological Mean: Year JAN FEB MAR APR MAY JUN JUL AUG SEP OCT NOV DEC 2004 NaN NaN NaN NaN NaN NaN NaN NaN 10.8 2.3 -0.8 -0.0 2005 0.2 -4.8 7.0 17.8 -13.7 31.6 10.5 1.4 -15.8 2.0 0.5 -0.0 2006 -0.3 -0.3 NaN 8.9 14.8 -29.6 6.6 -10.9 2.5 -1.9 0.4 -0.0 2007 -0.6 1.3 2.6 7.9 -0.3 28.6 18.9 18.9 7.8 1.1 -0.2 0.0 2008 -0.2 -1.0 8.3 -15.4 -10.0 0.8 -15.6 4.4 7.6 -3.3 -0.6 0.0 2009 0.1 -6.6 -34.3 -2.6 9.6 -26.4 -2.5 -5.0 -13.3 -1.3 1.2 0.0 2010 0.1 5.9 5.0 -6.4 -6.6 6.3 -13.0 -8.8 7.9 3.3 -0.1 -0.1 2011 0.4 0.4 8.5 -18.6 NaN NaN NaN Percent of Data Available during Each Month: Year JAN FEB MAR APR MAY JUN JUL AUG SEP OCT NOV DEC 2004 0.0 0.0 0.0 0.0 0.0 0.0 0.0 0.0 99.9 99.9 100.0 100.0 2005 100.0 98.7 98.9 100.0 100.0 100.0 100.0 100.0 100.0 99.7 100.0 100.0 2006 100.0 98.5 94.9 99.3 99.9 100.0 99.7 99.5 100.0 100.0 100.0 100.0 2007 100.0 100.0 100.0 100.0 100.0 100.0 100.0 100.0 100.0 100.0 100.0 100.0 2008 100.0 100.0 100.0 100.0 100.0 100.0 100.0 100.0 100.0 100.0 100.0 100.0 2009 100.0 100.0 99.9 100.0 100.0 99.9 99.9 100.0 99.9 99.7 100.0 100.0 2010 100.0 100.0 100.0 99.9 100.0 100.0 100.0 99.9 100.0 100.0 100.0 100.0 2011 100.0 100.0 100.0 99.6 63.2 0.0 0.0 Table 1e. Statistical summaries of reflected solar flux data at monthly resolution. Average, anomaly, and percentage of data available. 95 percent of the data must be available in order to calculate statistics. Periods with less than the 95 percent requirement are represented by NaN (not a number). Site name: Red Sheep Creek Variable: Reflected solar flux, in watts per meter squared File name: AK112_So_u_mon_stats.txt Date of file preparation: 05 Jul 2013 Name of file preparer: Frank Urban Monthly Averages: Year JAN FEB MAR APR MAY JUN JUL AUG SEP OCT NOV DEC 2004 NaN NaN NaN NaN NaN NaN NaN NaN 27.2 25.6 3.1 0.1 2005 1.4 17.3 68.3 147.2 64.1 53.7 44.2 29.2 13.8 13.2 3.1 0.1 2006 1.1 16.3 70.4 148.4 118.6 40.4 43.5 26.8 14.7 15.4 2.8 0.1 2007 1.0 17.4 69.5 144.9 139.5 55.7 52.2 36.6 18.3 10.1 2.6 0.0 2008 1.0 16.7 70.0 132.7 92.1 51.0 41.8 31.9 21.7 24.2 2.7 0.2 2009 1.1 16.0 72.1 146.1 119.1 44.2 46.9 32.4 27.3 20.2 2.7 0.1 2010 1.1 15.7 66.7 131.6 43.3 52.6 40.3 26.1 15.4 14.5 2.5 0.1 2011 1.2 15.0 65.9 148.4 NaN NaN NaN Anomaly Relative to the Climatological Mean: Year JAN FEB MAR APR MAY JUN JUL AUG SEP OCT NOV DEC 2004 NaN NaN NaN NaN NaN NaN NaN NaN 8.2 8.6 0.2 -0.0 2005 0.2 0.8 -0.9 4.1 -34.4 4.4 -0.7 -1.3 -5.2 -3.9 0.3 0.0 2006 -0.1 -0.2 1.1 5.2 20.1 -8.9 -1.3 -3.7 -4.3 -1.6 -0.0 -0.0 2007 -0.2 0.9 0.2 1.8 41.0 6.4 7.4 6.1 -0.7 -6.9 -0.2 -0.1 2008 -0.1 0.2 0.7 -10.4 -6.4 1.8 -3.1 1.4 2.7 7.1 -0.1 0.1 2009 -0.0 -0.5 2.9 3.0 20.5 -5.1 2.1 1.9 8.3 3.1 -0.1 0.0 2010 -0.0 -0.8 -2.6 -11.6 -55.2 3.3 -4.5 -4.4 -3.6 -2.6 -0.3 0.0 2011 0.1 -1.5 -3.4 5.3 NaN NaN NaN Percent of Data Available during Each Month: Year JAN FEB MAR APR MAY JUN JUL AUG SEP OCT NOV DEC 2004 0.0 0.0 0.0 0.0 0.0 0.0 0.0 0.0 100.0 100.0 100.0 100.0 2005 100.0 100.0 100.0 100.0 100.0 100.0 100.0 100.0 100.0 100.0 100.0 100.0 2006 100.0 100.0 100.0 100.0 100.0 100.0 100.0 99.6 100.0 100.0 100.0 100.0 2007 100.0 100.0 100.0 100.0 100.0 100.0 100.0 100.0 100.0 100.0 100.0 100.0 2008 100.0 100.0 100.0 100.0 100.0 100.0 100.0 100.0 100.0 100.0 100.0 100.0 2009 100.0 100.0 99.6 100.0 100.0 100.0 100.0 100.0 100.0 100.0 100.0 100.0 2010 100.0 100.0 100.0 99.7 100.0 100.0 100.0 99.9 100.0 100.0 100.0 100.0 2011 100.0 99.9 100.0 100.0 62.9 0.0 0.0 Table 1f. Statistical summaries of rainfall data at monthly resolution. Maximum, accumulated total, and percentage of data available. 95 percent of the data must be available in order to calculate statistics. Periods with less than the 95 percent requirement are represented by NaN (not a number). * * * * * * * * * * * * * * * * * * * * Data for this sensor is not available. * * * * * * * * * * * * * * * * * * * * Table 1g. Statistical summaries of snow depth data at monthly resolution. Average, minimum, maximum, anomaly, and percentage of data available. Anomalies are calculated relative to the entire available period of record for the given site. 90 percent of the data must be available in order to calculate statistics. Periods with less than the 90 percent requirement are represented by NaN (not a number). Site name: Red Sheep Creek Variable: Snow depth, in centimeters File name: AK112_snowD_mon_stats.txt Date of file preparation: 05 Jul 2013 Name of file preparer: Frank Urban Monthly Averages: Year JAN FEB MAR APR MAY JUN JUL AUG SEP OCT NOV DEC 2004 NaN NaN NaN NaN NaN NaN NaN NaN 3.9 15.7 25.3 32.8 2005 39.8 43.9 41.3 39.7 8.3 2.3 3.6 5.2 3.9 11.5 20.4 32.1 2006 34.6 40.3 45.9 47.3 23.2 1.5 4.8 5.4 4.7 6.6 11.3 14.9 2007 23.8 32.9 34.0 36.4 25.5 4.6 10.8 9.4 5.6 4.6 8.8 9.1 2008 15.1 19.3 23.4 27.8 12.7 2.9 7.0 8.3 3.0 17.5 26.4 31.1 2009 33.9 44.3 48.8 49.3 26.4 NaN NaN NaN 9.1 NaN NaN NaN 2010 NaN NaN NaN NaN NaN NaN NaN 10.8 9.2 12.7 22.5 33.3 2011 30.7 34.3 29.2 36.2 32.1 NaN NaN Minimum Value Each Month: Year JAN FEB MAR APR MAY JUN JUL AUG SEP OCT NOV DEC 2004 NaN NaN NaN NaN NaN NaN NaN NaN -0.5 11.1 22.7 28.2 2005 37.6 38.5 34.9 34.6 1.1 -1.0 0.1 0.7 1.6 3.7 16.4 25.9 2006 32.3 32.9 42.9 43.3 -0.6 -0.5 1.0 0.3 1.3 1.4 9.1 7.9 2007 17.9 30.4 31.3 33.0 1.5 0.3 0.4 -0.6 -0.2 -0.6 3.3 3.9 2008 8.8 14.7 15.0 23.4 -0.8 -0.6 -0.6 0.7 -0.8 1.4 21.6 27.9 2009 27.3 37.3 46.1 40.7 -0.7 NaN NaN NaN 0.1 NaN NaN NaN 2010 NaN NaN NaN NaN NaN NaN NaN 5.5 0.0 5.2 12.8 30.6 2011 25.5 27.5 26.3 32.4 13.5 NaN NaN Maximum Value Each Month: Year JAN FEB MAR APR MAY JUN JUL AUG SEP OCT NOV DEC 2004 NaN NaN NaN NaN NaN NaN NaN NaN 15.6 23.3 29.6 44.9 2005 42.5 46.7 45.7 43.8 33.7 4.9 6.4 8.8 9.5 21.8 29.5 35.8 2006 36.2 45.3 48.4 49.8 46.6 6.4 11.3 10.4 9.9 11.1 13.1 21.8 2007 33.1 36.3 37.2 40.4 42.6 14.1 19.6 18.9 14.8 11.3 13.3 14.6 2008 18.9 25.3 27.2 33.2 30.3 13.5 14.3 13.7 9.4 28.3 30.6 33.6 2009 40.7 53.7 52.5 54.7 42.0 NaN NaN NaN 21.8 NaN NaN NaN 2010 NaN NaN NaN NaN NaN NaN NaN 14.3 18.1 18.4 36.2 35.4 2011 36.5 39.9 39.5 39.3 37.3 NaN NaN Anomaly Relative to the Climatological Mean: Year JAN FEB MAR APR MAY JUN JUL AUG SEP OCT NOV DEC 2004 NaN NaN NaN NaN NaN NaN NaN NaN -1.7 4.2 5.2 6.2 2005 8.9 6.8 3.7 -0.1 -13.5 -1.4 -3.6 -2.7 -1.8 0.0 0.3 5.5 2006 3.7 3.2 8.3 7.4 1.3 -2.2 -2.4 -2.4 -0.9 -4.8 -8.8 -11.7 2007 -7.1 -4.1 -3.6 -3.5 3.6 0.9 3.6 1.6 -0.0 -6.8 -11.3 -17.5 2008 -15.8 -17.8 -14.2 -12.1 -9.1 -0.8 -0.2 0.5 -2.6 6.1 6.3 4.5 2009 3.0 7.2 11.3 9.4 4.6 NaN NaN NaN 3.5 NaN NaN NaN 2010 NaN NaN NaN NaN NaN NaN NaN 3.0 3.6 1.3 2.4 6.7 2011 -0.1 -2.8 -8.4 -3.7 10.2 NaN NaN Percent of Data Available during Each Month: Year JAN FEB MAR APR MAY JUN JUL AUG SEP OCT NOV DEC 2004 0.0 0.0 0.0 0.0 0.0 0.0 0.0 0.0 96.7 100.0 100.0 96.8 2005 100.0 100.0 100.0 100.0 100.0 100.0 96.8 85.2 85.3 90.6 100.0 100.0 2006 100.0 99.7 99.9 100.0 89.7 98.8 86.8 93.4 95.3 100.0 100.0 100.0 2007 99.9 100.0 100.0 100.0 98.7 96.4 90.5 94.5 95.7 95.7 99.2 100.0 2008 99.5 100.0 100.0 99.7 98.0 94.2 86.3 95.0 99.4 98.0 100.0 100.0 2009 100.0 98.5 100.0 100.0 83.9 0.0 0.0 0.0 90.3 0.0 0.0 0.0 2010 0.0 0.0 0.0 0.0 0.0 0.0 0.0 39.4 97.5 98.5 100.0 100.0 2011 100.0 97.5 100.0 99.3 63.0 0.0 0.0 Table 1h. Statistical summaries of soil moisture data at monthly resolution. Average, minimum, maximum, anomaly, and percentage of data available. Anomalies are calculated relative to the entire available period of record for the given site. 95 percent of the data must be available in order to calculate statistics. Periods with less than the 95 percent requirement are represented by NaN (not a number). Site name: Red Sheep Creek Variable: Soil moisture, in water fraction by volume File name: AK112_Smoist_mon_stats.txt Date of file preparation: 05 Jul 2013 Name of file preparer: Frank Urban Monthly Averages: Year JAN FEB MAR APR MAY JUN JUL AUG SEP OCT NOV DEC 2004 NaN NaN NaN NaN NaN NaN NaN NaN 0.592 0.246 0.104 0.069 2005 0.047 0.035 0.034 0.034 0.094 0.532 0.516 0.639 0.673 0.159 0.058 0.049 2006 0.033 0.024 0.023 0.024 0.052 0.366 0.688 0.685 0.690 0.547 0.045 0.023 2007 0.018 0.017 0.012 0.016 0.034 0.263 0.432 0.613 0.702 0.080 0.040 0.017 2008 NaN NaN NaN 0.010 0.038 0.216 0.591 0.707 0.701 0.274 0.064 0.039 2009 0.018 0.014 0.013 0.014 0.042 0.421 0.700 0.698 0.701 0.398 0.049 0.038 2010 0.021 0.016 0.017 0.022 0.059 0.315 0.509 0.710 0.728 0.187 0.041 0.027 2011 0.014 0.008 NaN 0.008 NaN NaN NaN Minimum Value Each Month: Year JAN FEB MAR APR MAY JUN JUL AUG SEP OCT NOV DEC 2004 NaN NaN NaN NaN NaN NaN NaN NaN 0.408 0.133 0.085 0.056 2005 0.038 0.033 0.032 0.032 0.037 0.348 0.435 0.590 0.667 0.062 0.048 0.043 2006 0.021 0.021 0.021 0.022 0.025 0.080 0.680 0.677 0.682 0.075 0.024 0.019 2007 0.016 0.012 0.011 0.011 0.016 0.063 0.409 0.509 0.501 0.042 0.025 0.011 2008 NaN NaN NaN 0.005 0.012 0.059 0.424 0.698 0.566 0.090 0.047 0.024 2009 0.014 0.013 0.011 0.011 0.021 0.062 0.689 0.688 0.694 0.064 0.038 0.028 2010 0.017 0.012 0.014 0.016 0.044 0.079 0.407 0.692 0.715 0.038 0.033 0.016 2011 0.005 0.005 NaN 0.005 NaN NaN NaN Maximum Value Each Month: Year JAN FEB MAR APR MAY JUN JUL AUG SEP OCT NOV DEC 2004 NaN NaN NaN NaN NaN NaN NaN NaN 0.671 0.407 0.132 0.086 2005 0.056 0.040 0.036 0.037 0.375 0.669 0.589 0.675 0.680 0.689 0.077 0.056 2006 0.044 0.027 0.026 0.028 0.081 0.699 0.695 0.692 0.697 0.716 0.076 0.028 2007 0.022 0.020 0.015 0.020 0.064 0.587 0.509 0.708 0.721 0.492 0.050 0.027 2008 NaN NaN NaN 0.014 0.060 0.507 0.709 0.713 0.715 0.568 0.091 0.052 2009 0.026 0.016 0.016 0.023 0.064 0.713 0.713 0.706 0.709 0.710 0.065 0.046 2010 0.030 0.020 0.019 0.046 0.080 0.407 0.695 0.728 0.756 0.710 0.045 0.042 2011 0.021 0.010 NaN 0.011 NaN NaN NaN Anomaly Relative to the Climatological Mean: Year JAN FEB MAR APR MAY JUN JUL AUG SEP OCT NOV DEC 2004 NaN NaN NaN NaN NaN NaN NaN NaN -0.099 -0.040 0.048 0.033 2005 0.023 0.018 0.017 0.017 0.044 0.195 -0.054 -0.036 -0.018 -0.127 0.003 0.013 2006 0.010 0.007 0.006 0.008 0.002 0.029 0.118 0.010 -0.001 0.261 -0.011 -0.013 2007 -0.005 -0.000 -0.005 -0.001 -0.016 -0.074 -0.138 -0.062 0.011 -0.206 -0.015 -0.019 2008 NaN NaN NaN -0.007 -0.012 -0.121 0.021 0.031 0.010 -0.012 0.009 0.003 2009 -0.005 -0.003 -0.004 -0.003 -0.008 0.084 0.131 0.022 0.010 0.112 -0.007 0.002 2010 -0.002 -0.001 -0.001 0.006 0.010 -0.022 -0.060 0.035 0.038 -0.099 -0.015 -0.009 2011 -0.010 -0.009 NaN -0.009 NaN NaN NaN Percent of Data Available during Each Month: Year JAN FEB MAR APR MAY JUN JUL AUG SEP OCT NOV DEC 2004 0.00 0.00 0.00 0.00 0.00 0.00 0.00 0.00 100.00 100.00 100.00 100.00 2005 100.00 100.00 100.00 100.00 100.00 100.00 100.00 100.00 100.00 100.00 100.00 100.00 2006 100.00 100.00 100.00 100.00 100.00 100.00 100.00 99.60 100.00 100.00 100.00 100.00 2007 100.00 100.00 100.00 100.00 100.00 100.00 100.00 100.00 100.00 100.00 100.00 100.00 2008 84.14 19.68 45.70 100.00 100.00 100.00 100.00 100.00 100.00 100.00 100.00 100.00 2009 100.00 100.00 100.00 100.00 100.00 100.00 100.00 100.00 100.00 100.00 100.00 100.00 2010 100.00 100.00 100.00 100.00 100.00 100.00 100.00 99.87 100.00 100.00 100.00 100.00 2011 100.00 100.00 65.05 100.00 63.17 0.00 0.00 Table 1i. Statistical summaries of surface pressure data at monthly resolution. Average, minimum, maximum, anomaly, and percentage of data available. Anomalies are calculated relative to the entire available period of record for the given site. 95 percent of the data must be available in order to calculate statistics. Periods with less than the 95 percent requirement are represented by NaN (not a number). * * * * * * * * * * * * * * * * * * * * Data for this sensor is not available. * * * * * * * * * * * * * * * * * * * * Table 2a. Statistical summaries of air temperature data at seasonal and annual resolution. Average, minimum, maximum, anomaly, and percentage of data available. Anomalies are calculated relative to the entire available period of record for the given site. 95 percent of the data must be available in order to calculate statistics. Periods with less than the 95 percent requirement are represented by NaN (not a number). Site name: Red Sheep Creek Variable: Air temperature, in degrees Celsius File name: AK112_Tair_sea_stats.txt Date of file preparation: 31 Oct 2013 Name of file preparer: Frank Urban Seasonal/Annual Averages: Year WINTER SPRING SUMMER AUTUMN ANNUAL 2004 NaN NaN NaN -11.53 NaN 2005 -21.61 -5.23 11.37 -9.71 -5.75 2006 -20.46 -9.66 10.16 -7.89 -6.90 2007 -20.20 -9.61 13.06 -7.80 -6.32 2008 -22.26 -7.83 10.26 -10.56 -7.78 2009 -23.19 NaN NaN NaN NaN 2010 NaN NaN NaN -6.70 NaN 2011 -23.05 NaN Minimum Value Each Season/Year: Year WINTER SPRING SUMMER AUTUMN ANNUAL 2004 NaN NaN NaN -34.74 NaN 2005 -36.33 -26.03 -2.05 -33.72 -35.56 2006 -39.26 -36.66 -9.23 -29.58 -39.26 2007 -40.41 -38.79 0.40 -23.18 -40.41 2008 -39.42 -33.88 -2.37 -31.68 -39.42 2009 -38.04 NaN NaN NaN NaN 2010 NaN NaN NaN -34.00 NaN 2011 -37.86 NaN Maximum Value Each Season/Year: Year WINTER SPRING SUMMER AUTUMN ANNUAL 2004 NaN NaN NaN 10.15 NaN 2005 -1.27 16.72 24.96 9.35 24.96 2006 0.88 13.66 21.01 16.10 21.01 2007 -3.43 15.53 23.91 14.77 23.91 2008 -0.53 15.42 23.82 14.69 23.82 2009 1.02 NaN NaN NaN NaN 2010 NaN NaN NaN 14.56 NaN 2011 1.06 NaN Anomaly Relative to the Climatological Mean: Year WINTER SPRING SUMMER AUTUMN ANNUAL 2004 NaN NaN NaN -2.39 NaN 2005 0.15 3.04 NaN -0.57 NaN 2006 1.30 -1.39 NaN 1.25 NaN 2007 1.57 -1.34 NaN 1.34 NaN 2008 -0.49 0.44 NaN -1.42 NaN 2009 -1.42 NaN NaN NaN NaN 2010 NaN NaN NaN 2.44 NaN 2011 -1.28 NaN Percent of Data Available during Each Season/Year: Year WINTER SPRING SUMMER AUTUMN ANNUAL 2004 0.00 0.00 0.00 100.00 0.00 2005 100.00 100.00 100.00 100.00 1.00 2006 100.00 100.00 99.86 100.00 1.00 2007 100.00 100.00 100.00 100.00 1.00 2008 100.00 100.00 100.00 100.00 1.00 2009 100.00 94.61 0.00 0.00 0.40 2010 0.00 0.00 13.41 100.00 0.37 2011 100.00 87.59 Table 2b. Statistical summaries of wind speed data at seasonal and annual resolution. Average, maximum, and percentage of data available. 95 percent of the data must be available in order to calculate statistics. Periods with less than the 95 percent requirement are represented by NaN (not a number). Site name: Red Sheep Creek Variable: Wind speed, in meters per second File name: AK112_U_sea_stats.txt Date of file preparation: 05 Jul 2013 Name of file preparer: Frank Urban Seasonal/Annual Averages: Year WINTER SPRING SUMMER AUTUMN ANNUAL 2004 NaN NaN NaN 0.98 NaN 2005 0.86 1.48 2.33 1.41 1.52 2006 NaN 1.35 2.31 1.12 1.41 2007 0.82 1.24 2.00 1.21 1.32 2008 1.00 1.58 1.99 1.20 1.44 2009 0.80 1.28 2.00 1.07 1.32 2010 1.11 1.66 2.01 NaN 1.48 2011 0.92 NaN Maximum Value Each Season/Year: Year WINTER SPRING SUMMER AUTUMN ANNUAL 2004 NaN NaN NaN 6.90 NaN 2005 6.72 8.77 6.79 7.16 8.77 2006 NaN 6.50 7.99 8.45 8.45 2007 5.95 7.28 7.94 6.37 7.94 2008 8.95 7.16 6.11 6.71 8.95 2009 8.41 5.41 6.64 5.98 8.41 2010 6.71 7.21 6.39 NaN 7.21 2011 9.68 NaN Anomaly Relative to the Climatological Mean: Year WINTER SPRING SUMMER AUTUMN ANNUAL 2004 NaN NaN NaN -0.18 NaN 2005 -0.10 0.08 0.22 0.25 0.11 2006 NaN -0.05 0.20 -0.04 -0.01 2007 -0.14 -0.16 -0.10 0.05 -0.10 2008 0.04 0.18 -0.12 0.04 0.03 2009 -0.16 -0.12 -0.11 -0.09 -0.10 2010 0.15 0.26 -0.09 NaN 0.07 2011 -0.04 NaN Percent of Data Available during Each Season/Year: Year WINTER SPRING SUMMER AUTUMN ANNUAL 2004 0.00 0.00 0.00 95.83 0.00 2005 98.43 100.00 100.00 99.73 0.98 2006 91.76 100.00 99.86 99.50 1.00 2007 100.00 100.00 100.00 100.00 1.00 2008 100.00 100.00 100.00 100.00 1.00 2009 95.32 100.00 99.91 99.68 0.99 2010 97.69 100.00 99.95 92.72 0.97 2011 95.88 87.59 Table 2c. Statistical summaries of ground temperature data at 10- and 120- centimeters depth at seasonal and annual resolution. Average, minimum, maximum, anomaly, and percentage of data available. Anomalies are calculated relative to the entire available period of record for the given site. 95 percent of the data must be available in order to calculate statistics. Periods with less than the 95 percent requirement are represented by NaN (not a number). Site name: Red Sheep Creek Variable: Ground temperature, in degrees Celsius File name: AK112_Tg_sea_stats.txt Date of file preparation: 31 Oct 2013 Name of file preparer: Frank Urban Seasonal/Annual Averages (10 cm depth): Year WINTER SPRING SUMMER AUTUMN ANNUAL 2004 NaN NaN NaN -0.34 NaN 2005 -5.03 -4.68 5.49 -1.03 -1.41 2006 -7.11 -6.68 4.62 -1.35 -3.01 2007 -9.87 -8.78 NaN NaN NaN 2008 NaN NaN NaN NaN NaN 2009 NaN NaN NaN NaN NaN 2010 NaN NaN NaN -0.96 NaN 2011 -9.51 NaN Minimum Value Each Season/Year (10 cm depth): Year WINTER SPRING SUMMER AUTUMN ANNUAL 2004 NaN NaN NaN -1.78 NaN 2005 -8.01 -7.88 0.07 -5.73 -8.01 2006 -11.69 -10.56 -0.05 -10.31 -11.69 2007 -12.78 -13.43 NaN NaN NaN 2008 NaN NaN NaN NaN NaN 2009 NaN NaN NaN NaN NaN 2010 NaN NaN NaN -5.88 NaN 2011 -14.69 NaN Maximum Value Each Season/Year (10 cm depth): Year WINTER SPRING SUMMER AUTUMN ANNUAL 2004 NaN NaN NaN 2.87 NaN 2005 -1.46 4.19 12.05 3.72 12.05 2006 -3.06 0.95 11.23 4.39 11.23 2007 -6.53 1.55 NaN NaN NaN 2008 NaN NaN NaN NaN NaN 2009 NaN NaN NaN NaN NaN 2010 NaN NaN NaN 8.75 NaN 2011 -3.00 NaN Anomaly Relative to the Climatological Mean (10 cm depth): Year WINTER SPRING SUMMER AUTUMN ANNUAL 2004 NaN NaN NaN 0.58 NaN 2005 2.85 2.04 0.44 -0.11 0.80 2006 0.77 0.03 -0.44 -0.43 -0.80 2007 -1.99 -2.07 NaN NaN NaN 2008 NaN NaN NaN NaN NaN 2009 NaN NaN NaN NaN NaN 2010 NaN NaN NaN -0.04 NaN 2011 -1.63 NaN Percent of Data Available during Each Season/Year (10 cm depth): Year WINTER SPRING SUMMER AUTUMN ANNUAL 2004 0.00 0.00 0.00 100.00 0.00 2005 100.00 100.00 33.29 100.00 1.00 2006 100.00 100.00 99.86 100.00 1.00 2007 100.00 97.96 0.00 0.00 0.41 2008 0.00 0.00 0.00 0.00 0.00 2009 0.00 0.00 0.00 0.00 0.00 2010 0.00 0.00 13.36 100.00 0.37 2011 100.00 87.59 Seasonal/Annual Averages (120 cm depth): Year WINTER SPRING SUMMER AUTUMN ANNUAL 2004 NaN NaN NaN -0.74 NaN 2005 -2.69 -5.05 -1.17 -0.51 -2.40 2006 -3.87 -6.48 -1.46 -0.57 -3.31 2007 -5.88 -8.22 -1.72 -0.60 -4.23 2008 -8.38 -9.42 -1.84 -0.70 -4.75 2009 -4.18 -6.51 -1.35 -0.56 -3.19 2010 -5.08 -6.50 -1.22 -0.51 -3.34 2011 -5.13 NaN Minimum Value Each Season/Year (120 cm depth): Year WINTER SPRING SUMMER AUTUMN ANNUAL 2004 NaN NaN NaN -0.95 NaN 2005 -5.39 -6.06 -2.20 -0.72 -6.06 2006 -6.98 -7.66 -2.94 -0.78 -7.66 2007 -8.63 -10.02 -3.87 -1.22 -10.02 2008 -12.74 -12.09 -3.81 -0.89 -12.74 2009 -7.12 -8.06 -2.78 -0.78 -8.06 2010 -8.32 -8.71 -2.37 -0.67 -8.71 2011 -8.80 NaN Maximum Value Each Season/Year (120 cm depth): Year WINTER SPRING SUMMER AUTUMN ANNUAL 2004 NaN NaN NaN -0.55 NaN 2005 -0.55 -2.15 -0.67 -0.38 -0.38 2006 -0.38 -2.89 -0.72 -0.38 -0.38 2007 -0.49 -3.87 -0.78 -0.44 -0.44 2008 -1.22 -3.77 -0.83 -0.55 -0.50 2009 -0.50 -2.74 -0.67 -0.38 -0.38 2010 -0.38 -2.31 -0.61 -0.38 -0.38 2011 -0.38 NaN Anomaly Relative to the Climatological Mean (120 cm depth): Year WINTER SPRING SUMMER AUTUMN ANNUAL 2004 NaN NaN NaN -0.14 NaN 2005 2.34 1.98 0.29 0.09 1.14 2006 1.16 0.55 -0.01 0.03 0.23 2007 -0.85 -1.19 -0.26 -0.00 -0.69 2008 -3.35 -2.39 -0.38 -0.10 -1.21 2009 0.85 0.52 0.11 0.04 0.35 2010 -0.05 0.53 0.24 0.09 0.19 2011 -0.10 NaN Percent of Data Available during Each Season/Year (120 cm depth): Year WINTER SPRING SUMMER AUTUMN ANNUAL 2004 0.00 0.00 0.00 100.00 0.00 2005 100.00 100.00 33.29 100.00 1.00 2006 100.00 100.00 99.86 100.00 1.00 2007 100.00 97.96 0.00 0.00 1.00 2008 0.00 0.00 0.00 0.00 1.00 2009 0.00 0.00 0.00 0.00 1.00 2010 0.00 0.00 13.36 100.00 1.00 2011 100.00 87.59 Table 2d. Statistical summaries of incident solar-flux data at seasonal and annual resolution. Average, anomaly, and percentage of data available. 95 percent of the data must be available in order to calculate statistics. Periods with less than the 95 percent requirement are represented by NaN (not a number). Site name: Red Sheep Creek Variable: Incident solar flux, in watts per meter squared File name: AK112_So_d_sea_stats.txt Date of file preparation: 05 Jul 2013 Name of file preparer: Frank Urban Seasonal/Annual Averages: Year WINTER SPRING SUMMER AUTUMN ANNUAL 2004 NaN NaN NaN 37.5 NaN 2005 2.2 160.0 208.6 29.1 100.8 2006 3.4 154.5 183.2 33.8 94.1 2007 3.8 159.6 216.3 36.4 104.7 2008 3.3 150.6 190.7 34.6 95.2 2009 1.6 147.1 183.1 29.0 90.8 2010 5.5 153.6 189.0 37.2 96.9 2011 3.8 NaN Anomaly Relative to the Climatological Mean: Year WINTER SPRING SUMMER AUTUMN ANNUAL 2004 NaN NaN NaN 4.1 NaN 2005 -1.5 4.7 13.4 -4.3 3.7 2006 -0.2 -0.9 -11.9 0.3 -3.0 2007 0.2 4.2 21.1 2.9 7.6 2008 -0.3 -4.8 -4.4 1.2 -1.9 2009 -2.0 -8.3 -12.1 -4.4 -6.3 2010 1.9 -1.8 -6.2 3.7 -0.2 2011 0.2 NaN Percent of Data Available during Each Season/Year: Year WINTER SPRING SUMMER AUTUMN ANNUAL 2004 0.0 0.0 0.0 99.9 0.0 2005 99.6 99.6 100.0 99.9 1.0 2006 99.5 98.0 99.7 100.0 1.0 2007 100.0 100.0 100.0 100.0 1.0 2008 100.0 100.0 100.0 100.0 1.0 2009 100.0 100.0 99.9 99.9 1.0 2010 100.0 100.0 100.0 100.0 1.0 2011 100.0 87.5 Table 2e. Statistical summaries of reflected solar-flux data at seasonal and annual resolution. Average, anomaly, and percentage of data available. 95 percent of the data must be available in order to calculate statistics. Periods with less than the 95 percent requirement are represented by NaN (not a number). Site name: Red Sheep Creek Variable: Reflected solar flux, in watts per meter squared File name: AK112_So_u_sea_stats.txt Date of file preparation: 05 Jul 2013 Name of file preparer: Frank Urban Seasonal/Annual Averages: Year WINTER SPRING SUMMER AUTUMN ANNUAL 2004 NaN NaN NaN 18.7 NaN 2005 5.9 92.6 42.2 10.1 38.0 2006 5.5 112.1 36.9 11.0 41.6 2007 5.8 117.7 48.1 10.3 45.8 2008 5.7 97.9 41.5 16.3 40.5 2009 5.4 112.1 41.1 16.8 44.1 2010 5.3 79.9 39.5 10.8 34.1 2011 5.1 NaN Anomaly Relative to the Climatological Mean: Year WINTER SPRING SUMMER AUTUMN ANNUAL 2004 NaN NaN NaN 5.7 NaN 2005 0.3 -10.5 0.7 -2.9 -2.7 2006 -0.1 8.9 -4.7 -2.0 1.0 2007 0.2 14.5 6.5 -2.7 5.1 2008 0.1 -5.2 -0.1 3.3 -0.2 2009 -0.2 9.0 -0.4 3.8 3.4 2010 -0.3 -23.2 -2.0 -2.2 -6.6 2011 -0.5 NaN Percent of Data Available during Each Season/Year: Year WINTER SPRING SUMMER AUTUMN ANNUAL 2004 0.0 0.0 0.0 100.0 0.0 2005 100.0 100.0 100.0 100.0 1.0 2006 100.0 100.0 99.9 100.0 1.0 2007 100.0 100.0 100.0 100.0 1.0 2008 100.0 100.0 100.0 100.0 1.0 2009 100.0 99.9 100.0 100.0 1.0 2010 100.0 99.9 100.0 100.0 1.0 2011 100.0 87.5 Table 2f. Statistical summaries of rainfall data at seasonal and annual resolution. Maximum, accumulated total, and percentage of data available. 95 percent of the data must be available in order to calculate statistics. Periods with less than the 95 percent requirement are represented by NaN (not a number). * * * * * * * * * * * * * * * * * * * * Data for this sensor is not available. * * * * * * * * * * * * * * * * * * * * Table 2g. Statistical summaries of snow depth data at seasonal and annual resolution. Average, minimum, maximum, anomaly, and percentage of data available. Anomalies are calculated relative to the entire available period of record for the given site. 90 percent of the data must be available in order to calculate statistics. Periods with less than the 90 percent requirement are represented by NaN (not a number). Site name: Red Sheep Creek Variable: Snow depth, in centimeters File name: AK112_snowD_sea_stats.txt Date of file preparation: 05 Jul 2013 Name of file preparer: Frank Urban Seasonal/Annual Averages: Year WINTER SPRING SUMMER AUTUMN ANNUAL 2004 NaN NaN NaN 15.1 NaN 2005 38.8 29.7 4.8 12.3 16.5 2006 35.5 39.2 3.9 7.6 20.2 2007 23.6 31.9 8.3 6.4 17.2 2008 14.4 21.3 6.1 15.7 16.4 2009 36.1 42.3 NaN 9.1 35.9 2010 NaN NaN NaN 14.8 18.8 2011 32.7 32.5 Minimum Value Each Season/Year: Year WINTER SPRING SUMMER AUTUMN ANNUAL 2004 NaN NaN NaN -0.5 NaN 2005 28.2 1.1 -1.0 1.6 -1.0 2006 25.9 -0.6 -0.5 1.3 -0.6 2007 7.9 1.5 -0.6 -0.6 -0.6 2008 3.9 -0.8 -0.6 -0.8 -0.8 2009 27.3 -0.7 NaN 0.1 -0.7 2010 NaN NaN NaN 0.0 0.0 2011 25.5 13.5 Maximum Value Each Season/Year: Year WINTER SPRING SUMMER AUTUMN ANNUAL 2004 NaN NaN NaN 29.6 NaN 2005 46.7 45.7 8.8 29.5 46.7 2006 45.3 49.8 11.3 13.1 49.8 2007 36.3 42.6 19.6 14.8 42.6 2008 25.3 33.2 14.3 30.6 33.6 2009 53.7 54.7 NaN 21.8 54.7 2010 NaN NaN NaN 36.2 36.2 2011 39.9 39.5 Anomaly Relative to the Climatological Mean: Year WINTER SPRING SUMMER AUTUMN ANNUAL 2004 NaN NaN NaN 1.7 NaN 2005 7.4 -3.6 NaN -1.0 -5.9 2006 4.1 6.0 NaN -5.8 -2.1 2007 -7.8 -1.3 NaN -7.0 -5.1 2008 -17.0 -12.0 NaN 2.3 -5.9 2009 4.8 9.0 NaN -4.3 13.5 2010 NaN NaN NaN 1.5 -3.6 2011 1.4 -0.8 Percent of Data Available during Each Season/Year: Year WINTER SPRING SUMMER AUTUMN ANNUAL 2004 0.0 0.0 0.0 98.9 0.0 2005 98.9 100.0 87.1 91.9 0.9 2006 99.9 96.5 92.9 98.4 1.0 2007 100.0 99.5 93.8 96.8 1.0 2008 99.8 99.2 91.8 99.1 1.0 2009 99.5 94.6 0.0 29.8 0.5 2010 0.0 0.0 13.3 98.7 0.4 2011 99.2 87.3 Table 2h. Statistical summaries of soil moisture data at seasonal and annual resolution. Average, minimum, maximum, anomaly, and percentage of data available. Anomalies are calculated relative to the entire available period of record for the given site. 95 percent of the data must be available in order to calculate statistics. Periods with less than the 95 percent requirement are represented by NaN (not a number). Site name: Red Sheep Creek Variable: Soil moisture, in water fraction by volume File name: AK112_Smoist_sea_stats.txt Date of file preparation: 05 Jul 2013 Name of file preparer: Frank Urban Seasonal/Annual Averages: Year WINTER SPRING SUMMER AUTUMN ANNUAL 2004 NaN NaN NaN 0.313 NaN 2005 0.051 0.054 0.623 0.295 0.301 2006 0.036 0.033 0.582 0.429 0.268 2007 0.020 0.021 0.438 0.272 0.188 2008 NaN NaN 0.508 0.346 NaN 2009 0.024 0.023 0.608 0.383 0.260 2010 0.025 0.033 0.514 0.317 0.222 2011 0.016 NaN Minimum Value Each Season/Year: Year WINTER SPRING SUMMER AUTUMN ANNUAL 2004 NaN NaN NaN 0.085 NaN 2005 0.033 0.032 0.348 0.048 0.032 2006 0.021 0.021 0.080 0.024 0.019 2007 0.012 0.011 0.063 0.025 0.011 2008 NaN NaN 0.059 0.047 NaN 2009 0.013 0.011 0.062 0.038 0.011 2010 0.012 0.014 0.079 0.033 0.012 2011 0.005 NaN Maximum Value Each Season/Year: Year WINTER SPRING SUMMER AUTUMN ANNUAL 2004 NaN NaN NaN 0.671 NaN 2005 0.086 0.375 0.675 0.689 0.689 2006 0.056 0.081 0.699 0.716 0.716 2007 0.028 0.064 0.708 0.721 0.721 2008 NaN NaN 0.713 0.715 NaN 2009 0.052 0.064 0.713 0.710 0.713 2010 0.046 0.080 0.728 0.756 0.756 2011 0.042 NaN Anomaly Relative to the Climatological Mean: Year WINTER SPRING SUMMER AUTUMN ANNUAL 2004 NaN NaN NaN -0.031 NaN 2005 0.024 0.024 0.077 -0.048 0.053 2006 0.009 0.004 0.036 0.085 0.021 2007 -0.007 -0.009 -0.107 -0.072 -0.060 2008 NaN NaN -0.038 0.002 NaN 2009 -0.003 -0.006 0.063 0.039 0.013 2010 -0.001 0.003 -0.032 -0.026 -0.026 2011 -0.010 NaN Percent of Data Available during Each Season/Year: Year WINTER SPRING SUMMER AUTUMN ANNUAL 2004 0.00 0.00 0.00 100.00 0.00 2005 100.00 100.00 100.00 100.00 1.00 2006 100.00 100.00 99.86 100.00 1.00 2007 100.00 100.00 100.00 100.00 1.00 2008 69.00 81.70 100.00 100.00 0.88 2009 100.00 100.00 100.00 100.00 1.00 2010 100.00 100.00 99.95 100.00 1.00 2011 100.00 75.82 Table 2i. Statistical summaries of surface pressure data at seasonal and annual resolution. Average, minimum, maximum, anomaly, and percentage of data available. Anomalies are calculated relative to the entire available period of record for the given site. 95 percent of the data must be available in order to calculate statistics. Periods with less than the 95 percent requirement are represented by NaN (not a number). * * * * * * * * * * * * * * * * * * * * Data for this sensor is not available. * * * * * * * * * * * * * * * * * * * * |
First posted January 17, 2014
For additional information contact: Part or all of this report is presented in Portable Document Format (PDF). For best results viewing and printing PDF documents, it is recommended that you download the documents to your computer and open them with Adobe Reader. PDF documents opened from your browser may not display or print as intended. Download the latest version of Adobe Reader, free of charge. |

![]() U.S. Department of the Interior |
U.S. Geological Survey
U.S. Department of the Interior |
U.S. Geological Survey
URL: http://pubsdata.usgs.gov/pubs/ds/812/RedSheepCreek/RedSheepCreek.html
Page Contact Information: GS Pubs Web Contact
Page Last Modified: Monday, 28-Nov-2016 19:25:09 EST
