Fact Sheet 2002–0011

A network of seven observation wells that transmit ground-water-level data on a real-time basis through satellite telemetry is operating (started May 2001) in New Jersey through a cooperative effort of the U.S. Geological Survey (USGS) and the New Jersey Department of Environmental Protection (NJDEP). The water-level data from these observation wells are transmitted every 4 hours and then are immediately posted for viewing on the Internet. This fact sheet describes the rationale for real-time monitoring of ground-water levels, the design of the network, and the equipment used to measure water levels and transmit the data to the Internet. Instructions for viewing the data are included.
This network was created to provide data to indicate water-level trends in shallow ground-water systems within the State of New Jersey and to make the data available in the shortest time possible. The wells in this network are located throughout New Jersey (fig. 1) and were chosen because they are completed in shallow aquifers (table 1). The monitoring of shallow aquifers is important because these aquifers are relied on for water supply and irrigation. Additionally, the natural discharge from shallow aquifers provides base flow to streams. Water levels in these aquifers respond relatively quickly to precipitation and dry periods, so the rapid reporting of water-level data is necessary to follow trends. This network, for example, provides data that allow observation of the onset of drought conditions in ground water. Also, the data from this network can be used to estimate the most recent water-level trend in surficial-aquifer wells not outfitted with satellite telemetry. Table 1. Characteristics of the seven wells in the real-time ground-water level network
| 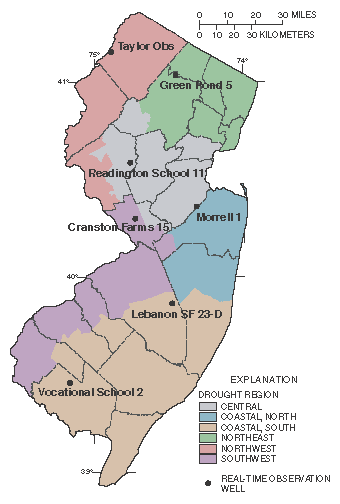 Figure 2. Typical equipment at a real-time ground-water-level network site, including the observation well, equiment shelter, data collection platform, solar power panel, and satellite antenna. |
Three of the wells are completed in the unconfined parts of the sand and gravel aquifers of the New Jersey Coastal Plain, namely the Kirkwood-Cohansey aquifer system and the Englishtown aquifer system. Further information about the aquifers of the Coastal Plain can be found in Zapecza (1989). Three of the wells are completed in bedrock in northern New Jersey, namely the Passaic Formation, Stockton Formation, and the Bossardsville Limestone (table 1). Although these wells are deeper, the fractures in the bedrock are connected to the land surface; therefore, water levels respond quickly to precipitation. One well is completed in a stratified drift in northern New Jersey. Water levels have been collected at these seven sites for periods that range from 11 to 78 years. Herman and others (1998) summarize the significant aquifers of New Jersey. Well locations were selected to obtain an even distribution of sites throughout New Jersey and to attempt to locate wells within each of the six Drought Regions established by NJDEP (Hoffman, 2001). The areas represented by each Drought Region (fig. 1) are based on large-scale watersheds and similarity of water-supply characteristics, and are defined "so as to match municipal boundaries in order to assist enforcement of mandated water cutbacks during drought emergencies" (Hoffman 2001, p. 1). No wells in the network are currently (2001) located in the Coastal North Region, but the Morrell 1 well in the Central Region is close to the boundary with the Coastal North Region. |
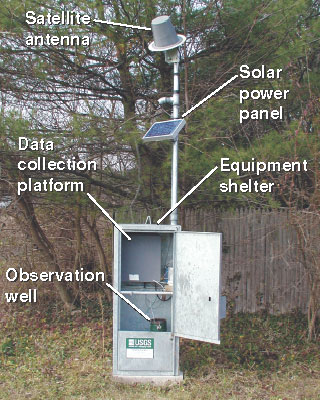 Figure 2. Typical equipment at a real-time ground-water-level network site, including the observation well, equiment shelter, data collection platform, solar power panel, and satellite antenna. |
| Water levels in each well in the network are automatically measured at hourly intervals and stored by a Data Collection Platform (DCP) located on site (fig. 2). Every 4 hours, a burst of data is broadcast from the site to the GOES satellite and relayed to a ground station. The data are retransmitted by the DOMSAT satellite to a USGS ground station, decoded, and automatically posted to the New Jersey District USGS Internet web page for viewing (fig. 3). To ensure the accuracy of the data, each well is visited every 6 to 8 weeks by a USGS technician who makes a manual water-level measurement to check the automated system and to perform maintenance on the equipment. | 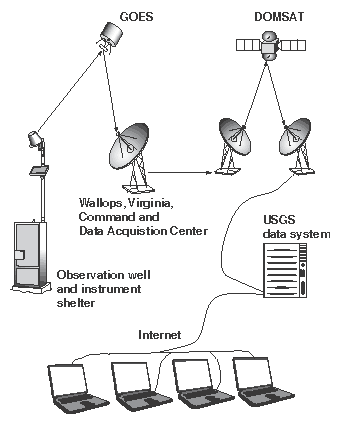
Figure 3. Schematic drawing showing data transmission from an observation well through satellite telemetry to users on the Internet. |
The ground-water level data from this network can be viewed by following these instructions:
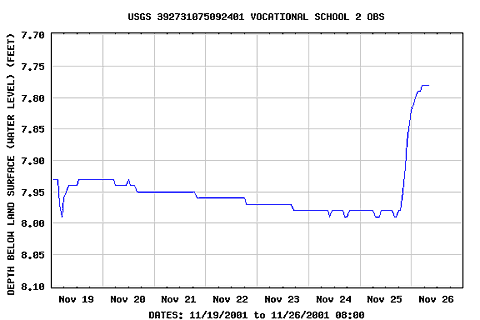
Figure 4. Example of an actual ground-water hydrograph that can be viewed an printed from the real-time network Web page. |
The monthly statistics and historical data are provided on the web page to put the current water level in context. The number of years of data used to calculate the statistics is provided first. Statistics on the water levels are provided in terms of the depth to water below land surface. The minimum depth to water for a well actually describes the highest water level measured in that well for the month, and the maximum depth to water describes the lowest water level for the month. The 75 and 25 percent exceedance values are the water levels that were surpassed by 75 and 25 percent, respectively, of all daily mean depths to water during the month. The latest water-level value (obtained from the table or from the line above the hydrograph) can be compared to the monthly statistics.
Because the water-level data are shown automatically, the message "Provisional data subject to revision" is incorporated into the graphs and charts on the Web page. If problems with the measurement, communication, or storage systems are found, revisions will be made to the USGS database at a later time to provide the corrected values. For more information about this issue, click on the "Provisional data subject to revision" heading.
For these seven sites, daily mean depths to water below land surface also are available for the last 550 days (approximately 18 months). A location map, water-quality data, and a database of monthly water levels can be accessed from the home page for each well.
USGS, in cooperation with NJDEP and other agencies, regularly monitors water levels in about 188 other wells in New Jersey. The data from these wells, although not posted on a real-time basis, are available on the Web site http://nj.usgs.gov/gw/gw_hydrographs.html. Ground-water data for all wells routinely monitored by USGS, including those of the real-time network, are summarized in an annually published report. (for example, Jones, 2001).
The installation of data collection platforms (DCP's) and satellite telemetry at eight wells is planned for spring 2002. The ultimate goal of this joint effort of the USGS and the NJDEP is to create a network of 21 wells, one for each county in New Jersey.
Herman, G.C., Canace, R.J., Stanford, S.D., Pristas, R.S., Sugarman, P.J., French, M.A., Hoffman, J.L., Serfes, M.S., and Mennel, W.J., 1998, Aquifers of New Jersey: New Jersey Geological Survey, Open-File Map, OFM-24, 1 sheet.
Hoffman, J. L., 2001, Development of New Jersey drought regions: New Jersey Geological Survey Technical Memorandum 01-1, 18 p.
Jones, W. D., 2001, Water Resources Data, New Jersey, Water Year 2000, Volume 2. Ground-Water Data: U. S. Geological Survey Water-Data Report NJ-00-2, 233 p.
Zapecza, O.S., 1989, Hydrogeologic framework of the New Jersey Coastal Plain: U. S. Geological Survey Professional Paper 1404-B, 49 p., 24 pl.
Jones, W.W., Navoy, A.S., and Pope, D.A., 2002, Real-time ground-water-level monitoring in New Jersey, 2001: U.S. Geological Survey Fact Sheet 2002-0011, https://pubs.usgs.gov/fs/2002/0011.

![]() U.S. Department of the Interior |
U.S. Geological Survey
U.S. Department of the Interior |
U.S. Geological Survey
URL: http://pubsdata.usgs.gov/pubs/fs/2002/0011/index.html
Page Contact Information: GS Pubs Web Contact
Page Last Modified: Tuesday, 29-Nov-2016 18:13:07 EST
