
U.S. Geological Survey
Fact Sheet 076-01
Online Version 1.0
Mapping the Sea Floor of the Historic Area Remediation Site (HARS) Offshore of New York City
Repeated surveys using a multibeam mapping system document changes in the topography and distribution of sediments on the sea floor caused by placement of dredged material, remedial capping, and natural processes.
By
Bradford Butman
Introduction
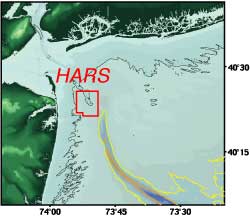
The area offshore of New York City has been used for the disposal of dredged material for over a century. The area has also been used for the disposal of other materials such as acid waste, industrial waste, municipal sewage sludge, cellar dirt, and wood. Between 1976 and 1995, the New York Bight Dredged Material Disposal Site, also known as the Mud Dump Site (MDS), received on average about 6 million cubic yards of dredged material annually. In September 1997 the MDS was closed as a disposal site, and it and the surrounding area were designated as the Historic Area Remediation Site (HARS) (figs. 1 and 2). The sea floor of the HARS, approximately 9 square nautical miles in area, currently is being remediated by placing a minimum 1-m-thick cap of clean dredged material on top of the surficial sediments that are contaminated from previous disposal of dredged and other materials. The U.S. Geological Survey (USGS) is working cooperatively with the U.S. Army Corps of Engineers (USACE) to map the sea floor geology of the HARS and changes in the characteristics of the surficial sediments over time.
|
|
Figure 1. Map showing the area offshore of New York and New Jersey that has been used for the disposal of dredged materials and other wastes since the late 1800's. The Historic Area Remediation Site (HARS) is outlined in red.
|
|
|
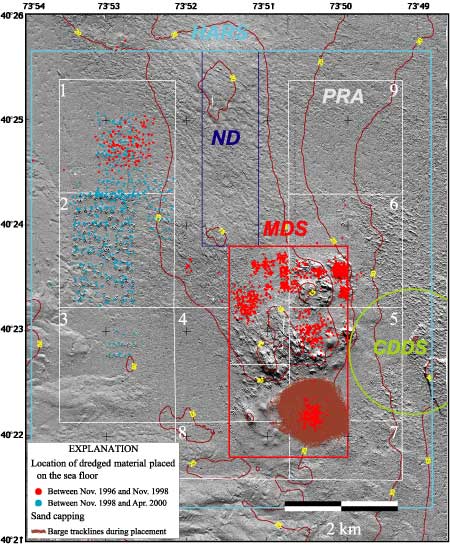
Figure 2. Shaded relief image of the Historic Area Remediation Site (HARS) in April 2000 showing the Primary Remediation Area (PRA, divided into nine cells), the no discharge zone (ND), the former Mud Dump Site (MDS), and the discontinued Cellar Dirt Disposal Site (CDDS). Companion images are shown in figures 4 and 5. See text for a description of this image and major features. Bathymetric contour interval is 5 m (red lines).
|
High-resolution surveys of the sea floor of the HARS
Surveys of the HARS were conducted in November 1996 (prior to the closing of the Mud Dump Site), November 1998 (during early remediation of the HARS), and April 2000 (during continued remediation of the HARS) using a Simrad EM1000 multibeam mapping system (fig. 3). Survey lines were run approximately 100 m apart to provide full coverage of the sea floor. The EM1000 measured the depth of water (to an accuracy of about 30 cm) as well as the intensity of sound reflected from the sea floor, which is referred to as backscatter intensity. High backscatter intensity generally indicates the presence of rocks and coarse-grained sediments, while low backscatter intensity indicates the presence of finer grained sediments. Direct observations using bottom photographs, video, and grab samples are needed to verify interpretations of the sea floor geology based on backscatter intensity.

|
|
Figure 3. High-resolution multibeam mapping systems use sound from an array of transducers to measure water depth and sediment characteristics of the sea floor. The horizontal resolution of the maps is a few meters, providing an image of the sea floor topography and sediment properties somewhat comparable to an aerial photograph.
|
Images of the HARS sea floor
In this fact sheet, the topography and backscatter intensity data measured by the multibeam mapping system are presented in three types of images. Each of these images highlights different features and characteristics of the sea floor.
- A shaded relief image (fig. 2) visually shows small topographic features (with relief of a few meters) that could not be effectively shown by contours alone at this scale. The image was created by vertically exaggerating the topography four times and then artificially illuminating the relief by a light source positioned 45° above the horizon from the north. In this image, topographic features are enhanced by strong illumination on the north-facing slopes and by shadows cast on the south-facing slopes.
- A shaded relief image, colored by backscatter intensity, combines the high-resolution view of topography with a measure of sediment characteristics (figs. 4, 5B, and 6). In these images, the backscatter intensity is represented by a suite of eight colors ranging from blue, which represents low intensity (fine-grained sediments), to red, which represents high intensity (rock outcrops and coarse-grained sediments). These data are draped over the shaded relief image. The resultant image displays light and dark intensities within each color band that result from a feature's position with respect to the light source. For example, north-facing slopes, receiving strong illumination, show as a light intensity within a color band, whereas south-facing slopes, being in shadow, show as a dark intensity within a color band.
- A shaded relief image, colored by bathymetry, combines the high-resolution view of topography with color to show water depth (fig. 5A).
|
|
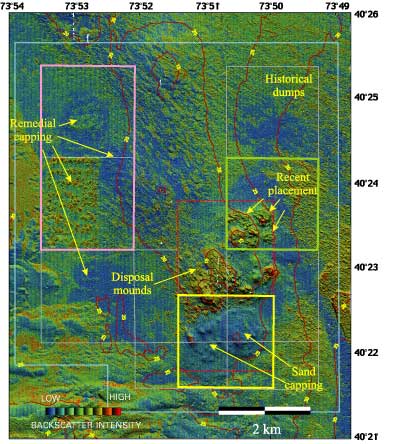
Figure 4. Pseudo-colored backscatter intensity and shaded relief map of the entire HARS in April 2000. The faint north-trending stripes run parallel to the survey tracklines and are artifacts of data collection and environmental conditions. The pink, green, and yellow boxes outline areas shown in figure 6 to illustrate changes in backscatter intensity between 1996, 1998, and 2000. See text for a description of this image and major features. Bathymetric contour interval is 5 m (red lines).
|
The sea floor of the HARS
Within the HARS, one of the most striking aspects of the sea floor is the variability in backscatter intensity and bottom morphology over distances of a few kilometers or less, caused by both natural and anthropogenic processes. This fact sheet presents companion images showing the sea floor of the HARS as mapped in April 2000 in plan view (figs. 2, 4, and 6) and in perspective view (fig. 5). Images of selected areas in 1996, 1998, and 2000 illustrate changes over time (fig. 6). Major features of the sea floor of the HARS shown in these images include two relatively smooth topographic highs composed of material dumped in the late 1800's and early 1900's ("Topographic highs" in fig. 5A); mounds of material in the Mud Dump Site ("Disposal mounds in MDS" in fig. 5A); two circular features where contaminated sediments were placed and then capped with sand, one in the late 1980's, and the other in 1997 ("Sand capping" in figs. 4 and 5B and "Previous capping" and "New sand capping" in fig. 6); material deposited between the November 1996 and November 1998 survey ("Recent placement" in figs. 4 and 5A); many features about 50 m in size interpreted to be individual dumps of material ("Historical dumps" in fig.. 4 and 5B); and material placed as part of remediation activities ("Remedial capping" in figs. 4, 5B, and 6).
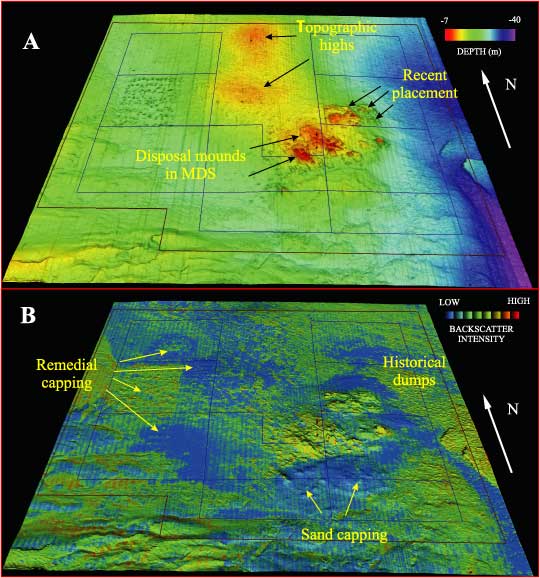
Figure 5. Perspective view of the Historic Area Remediation Site, looking from south to north, based on the multibeam survey carried out in April 2000. A, Shaded relief map with color-coded bathymetry. B, Backscatter intensity draped over shaded relief (see text for a description of the color scheme). The north-trending stripes, running parallel to the survey tracklines, are artifacts of data collection and environmental conditions. The topography, surface features, and the surficial sediments of the HARS have been heavily influenced by the disposal of dredged and other material in this region over the last century, and by recent remedial capping. See text for a description of these images and major features.
|
Changes in surficial properties between 1996, 1998, and 2000
Comparison of the topography and backscatter intensity from the three multibeam surveys show how the area changed as a result of dredged material placed before the Mud Dump Site was closed and ongoing remediation of the HARS (see fig. 2 for locations of placed material from USACE records).
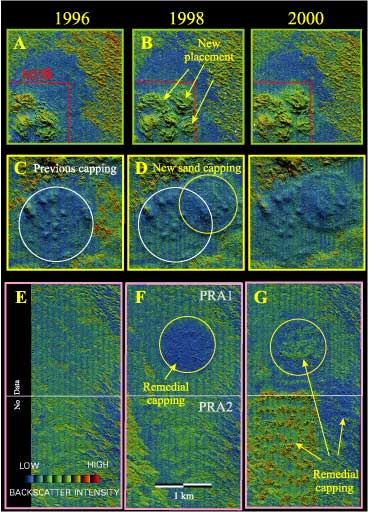
Between 1996 and 1998, changes include (1) mounds of medium backscatter intensity dredged material in the northeastern corner of the MDS, some as high as 6 m, placed between November 1996 and September 1997 (compare panels A and B, fig. 6); (2) a circular area of low-backscatter intensity material about 1 km in diameter and 2 m thick in the southern part of the MDS associated with sand capping (compare panels C and D, fig. 6); and (3) a circular area of low backscatter intensity material in PRA1 associated with remedial capping (compare panels E and F, fig. 6).
Between 1998 and 2000, changes include (compare panels F and G, fig. 6) (1) increased backscatter intensity in PRA1 due to additional placement of material and consolidation, de-watering, and possible winnowing of the previous cover; (2) a series of crater-like features in the western part of PRA2, 30 to 70 m long and on the order of 20 m wide with elevated rims and central depressions, that were apparently formed as remedial material impacted the soft sediments on the sea floor; and (3) an area of reduced backscatter intensity in the northeastern corner of PRA2 caused by the placement of remedial material.
Resolution limits of the multibeam system, and the amount of material placed over a relatively large area, preclude using the repeated topographic surveys for determining the amount of material placed on the sea floor. However these multibeam data clearly show the overall regional geology and, through comparison of topography and backscatter intensity, document the location of placed material and changes in sediment properties over time.
|
|
Figure 6. Pseudo-colored backscatter intensity and shaded relief map of parts of the HARS in 1996, 1998, and 2000 (see fig. 4 for location). These images illustrate changes in the sea floor topography and backscatter intensity that occurred between 1996 and 1998 and between 1998 and 2000 caused by placement of dredged material and by remedial capping. See text for a description of these images and major features.
|
For more information, please contact:
Bradford Butman
U.S. Geological Survey
384 Woods Hole Road
Woods Hole, MA 02543-1598
E-mail: bbutman@usgs.gov
or
http://woodshole.er.usgs.gov/project-pages/newyork/
Return to INDEX PAGE
U.S. Department of the Interior, U.S. Geological Survey
URL: https://pubsdata.usgs.gov/pubs/fs/2002/fs001-02/fs001-02.html
For more information, contact Bradford Butman
Maintained by Eastern Publications Group
Last modified: 18:13:00 Tue 29 Nov 2016
Privacy statement | General disclaimer | Accessibility