 |
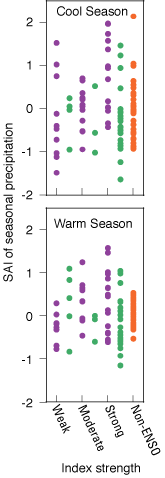
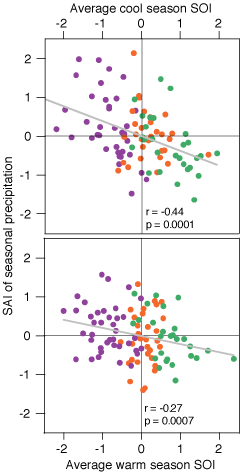
| Figure
4. Seasonal precipitation (standardized anomaly index, SAI) for
the Colorado Plateau, classified by El Niño-Southern Oscillation
(ENSO) or non-ENSO influence as a function of the Southern Oscillation
Index (SOI). Purple, light green, and orange symbols are El Niño,
La Niña, and non-ENSO, respectively. SOI was averaged over
a 7-month window centered on the midpoint of the season. |
|
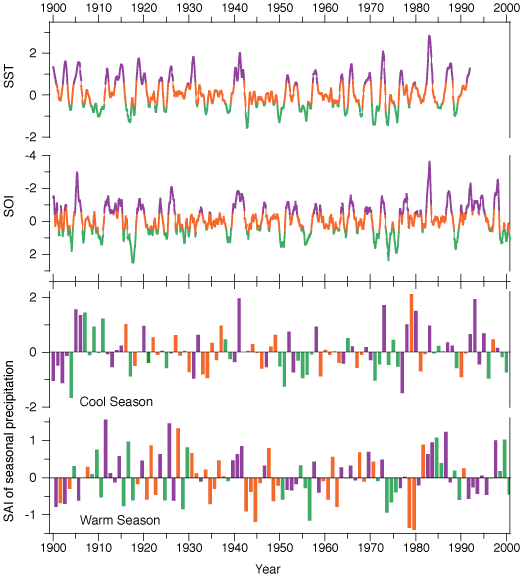 |
| Figure
5. Seasonal precipitation (standardized anomaly index, SAI) for
the Colorado Plateau compared with El Niño-Southern Oscillation
(ENSO) chronology of sea-surface temperature (SST; Niño3 Indices)
and Southern Oscillation Index (SOI). Color pattern same as figure
4. SST and SOI were smoothed with 5-month running average with ENSO
threshold conditions for SST of 0.4 and –0.3°C and SOI threshold
of ±0.5 standard deviation. |
|