U.S. Department of the Interior
U.S. Geological Survey
Fact Sheet FS-2004-3017
February 2004
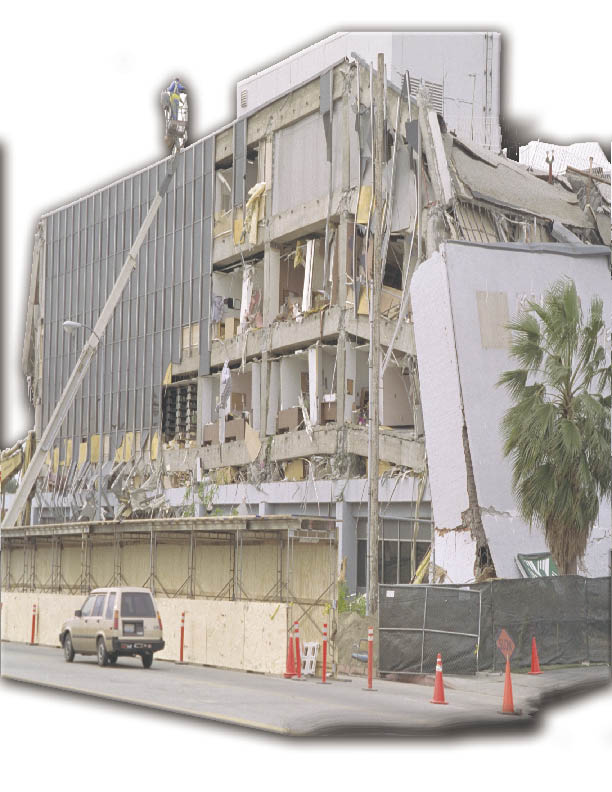
National and regional earthquake hazards maps are critical to effective hazard-mitigation strategies for communities prone to earthquakes. For this reason, NEHRP conducts studies in urban areas to produce hazard assessments that reflect local variations in geology and seismic-wave propagation. The greatest challenge in producing credible and useful regional hazard assessments is reducing modeling uncertainties through more accurate and abundant geological and seismological observations. This pertains particularly to information on where earthquakes originate (source), their size (magnitude) and recurrence time, and site-specific ground-shaking effects. To acquire this information in urban areas, studies are conducted that measure near-surface attributes such as geologic setting, structure, seismic velocity, topography, ground water, and rock properties.
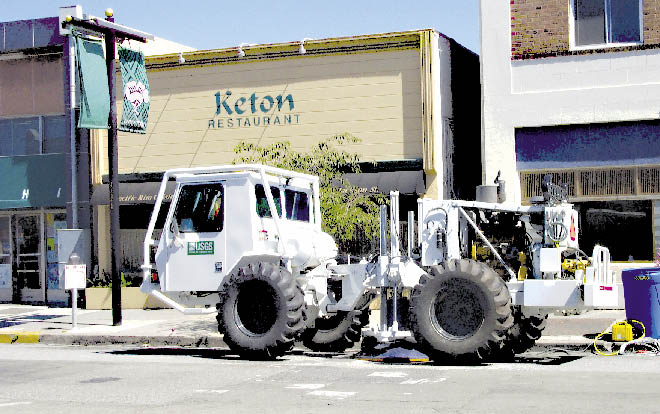
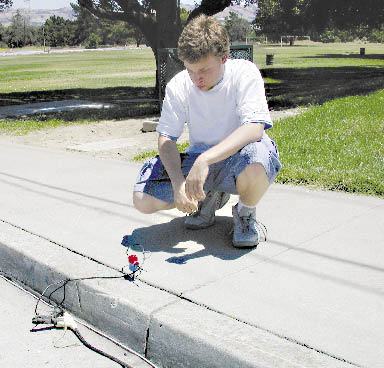
To meet this challenge, the U.S. Geological Survey has adapted and modified existing equipment and data- acquisition techniques. The equipment used to collect information must be powerful enough for survey needs without damaging streets and nearby structures or disrupting the flow of traffic or pedestrians. The signal-recording equipment (geophone sensors and cables) must be sensitive enough to record the seismic signal over nearly a mile in the noisy city environment without interfering with everyday community activities.
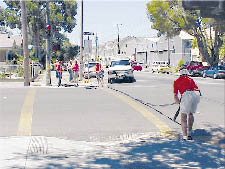
Hundreds of vibration points are integrated to produce a depth cross-section of the rocks beneath a city. Computer processing corrects for elevation changes, bends in line geometry and missing geophones (street crossings). Noise filtering and signal enhancement software is used to remove some of the degrading effects introduced by the everyday background noise.
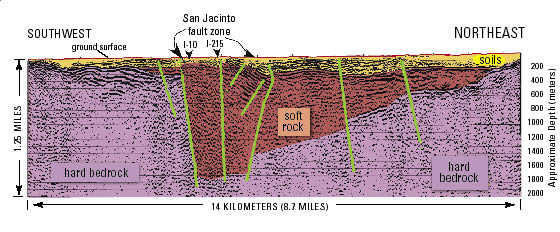
The subsurface images or "pictures" that result from these studies in the streets of the urban community increase our knowledge of earthquake occurrence, potential earthquake ground shaking, and the geology that commonly controls water flow. From the subsurface "pictures" we are able to see faults and determine if and how they move. These images also help explain why different parts of a city shake more strongly than others and contribute to work that could lead to forecasting future earthquake ground shaking. Also, knowing the position and geometry of faults and the thickness of rock layers and unconsolidated materials will improve our ability to create ground-water models and, ultimately, lead to better management of the existing water supply.

Earthquake Hazards Program
U.S. Geological Survey
Golden, CO 80401
Written by Jackson K. Odum, Robert A. Williams, William J. Stephenson, and David M. Worley
Graphics and layout design by Eleanor M. Omdahl
This Fact Sheet is available online at:
https://pubs.usgs.gov/fs/2004/3017/
Document Accessibility: Adobe Systems Incorporated has information about PDFs and the visually impaired. This information provides tools to help make PDF files accessible. These tools convert Adobe PDF documents into HTML or ASCII text, which then can be read by a number of common screen-reading programs that synthesize text as audible speech. In addition, an accessible version of Acrobat Reader 6.0, which contains support for screen readers, is available. These tools and the accessible reader may be obtained free from Adobe at Adobe Access.
| AccessibilityFOIAPrivacyPolicies and Notices | |
| |
|