|
|
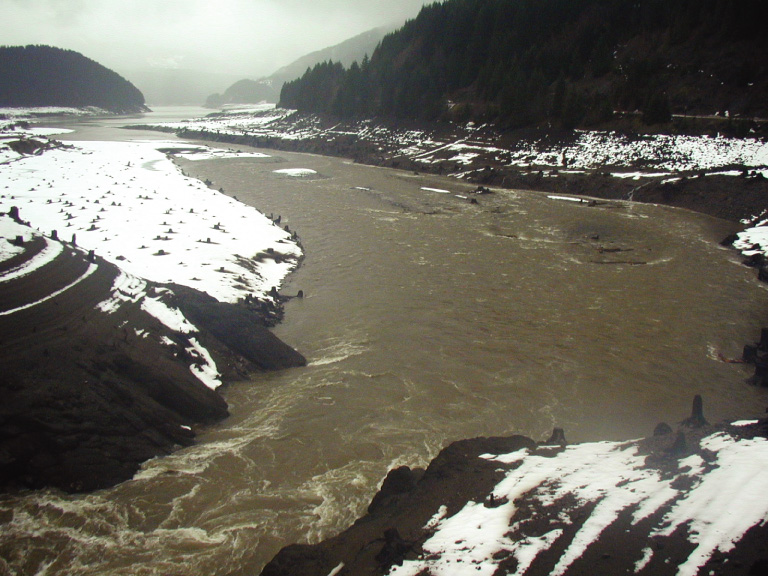
In February 1996, Northwest Oregon experienced some of the most severe flooding in recorded history. Heavy, warm rain fell on above average snowpack in the Cascade Range of the Willamette River Basin, resulting in 50- to 100-year flood events in many area rivers. The North Santiam River at Mehama crested at nearly 2½ feet above flood stage on the afternoon of February 7, 1996. Although the water level returned to normal within a few weeks, the water quality was affected for months to come.
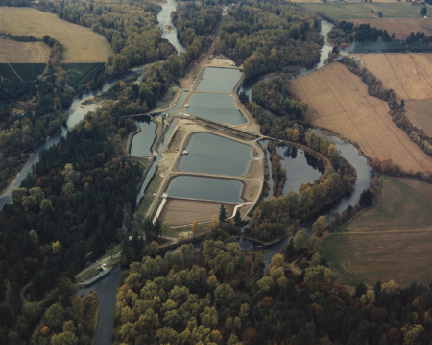
The City of Salem water-treatment facility (right) withdraws water from the North Santiam River. Changes in water quality, as during floods, affect the facility's operation.
|
|
|
|
Why Monitor Water Quality?
The water quality of the North Santiam River is important to more than 170,000 residents of the Salem, Oregon area that rely on the river as their primary source of drinking water. The river normally runs so clear that the City of Salem is able to use a relatively inexpensive and environmentally low-impact water-treatment process called slow-sand filtration. This process uses sand and gravel filters to remove suspended organic and inorganic particles in conjunction with natural biological processes to remove dissolved organic contaminants. If the river turbidity (see inset, right) is greater than 10 NTU, these filters can become clogged. To keep the facility running smoothly, the intake water is tested daily. If the turbidity remains consistently above 10 NTU, the water intakes are closed.
During the 1996 flooding, the North Santiam River had turbidity values in excess of 100 NTU at the water-treatment facility intakes. (It is impossible to determine the exact maximum turbidity value because there was no continuous water-quality monitoring system in place at the time.) Much of the water entering Detroit Lake was held back to prevent further flooding downstream. When the turbid waters of the North Santiam tributaries flowed into the lake, the larger sand particles settled out of the water. The fine silt and clay particles, stirred by currents, wind and waves, remained suspended.
As the flood waters downstream receded, the U.S. Army Corps of Engineers released water from Detroit Lake. This turbid lake water flowed downstream, keeping turbidity values at the water-treatment facility intakes high until July 1996. The City of Salem was forced to temporarily cease operations of the facility for 8 days and acquire water from reserve sources and neighboring communities until an alternate treatment scheme was developed.
|
What Is TURBIDITY?
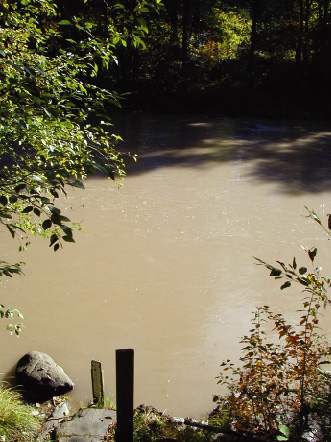
Turbidity is a measure of the "muddiness" of water caused by suspended and dissolved material, as well as organic matter. The currently accepted numerical measure of turbidity is the nephelometric turbidity unit (NTU). An NTU value represents the amount of light scattered by particles in the water. As the number of suspended particles in the water increases, the intensity of scattered light increases, which results in higher turbidity values. In this photograph, the North Santiam River near Detroit has a turbidity of approximately 700 NTU.
|
|
|
In 1998, a monitoring program was initiated to better understand the sources and transport of sediment that causes high turbidity within the North Santiam River Basin. The project is a cooperative effort of the City of Salem, the U.S. Geological Survey (USGS), the U.S. Forest Service, and the U.S. Army Corps of Engineers. In anticipation of future events like the 1996 flooding, the agencies now continuously monitor hydrologic and water-quality conditions throughout the basin. The data collected by this program are available online in real-time and are used by the cooperators for current operational decisions, ongoing research projects and future basin management. |
|
|
|
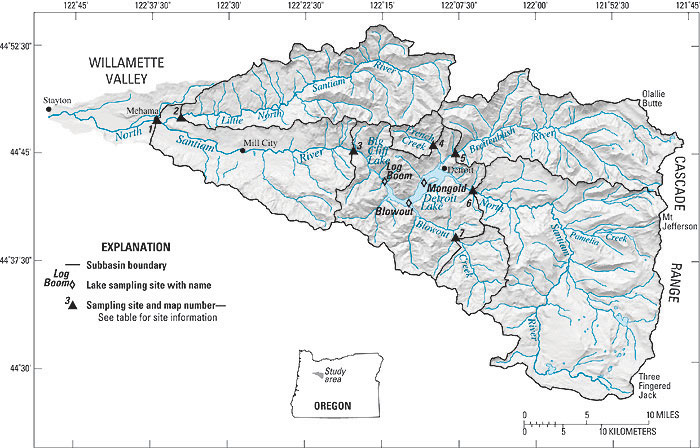
The North Santiam River Basin Study The North Santiam River Basin is located on the western slopes of the Cascade Range in northwestern Oregon, east of Salem. The river flows west from Mount Jefferson to the Willamette River, draining 766 square miles upstream from Salem's water-treatment facility. The geology of the central part of the basin is dominated by Western Cascade volcanic rocks. The steep terrain and older, weathered soils of this area produce many earthflows and landslides that supply sediment to the rivers. The central basin is bounded on the east by less steep and younger High Cascades volcanics and on the west by Willamette Valley alluvial lowlands. Average annual precipitation in the area ranges from 45 inches in Stayton to over 200 inches at Mount Jefferson. The basin contains the main-stem North Santiam River, its major tributaries (Breitenbush River, Blowout Creek, French Creek, and the Little North Santiam River), and two reservoirs (Detroit Lake and Big Cliff Lake), formed by the damming of the river. The reservoirs are operated by the Corps of Engineers for power generation, flood control, streamflow management, and recreation.
|
|
|
How Is Water Quality of the North Santiam River Monitored? The USGS operates a network of monitoring stations (sites) throughout the North Santiam River Basin. Seven sites provide water-quality and streamflow information (table 1). Three sites are located downstream from Detroit Lake (map numbers 1-3), and four sites are located on streams that flow into the lake (map numbers 4-7). Each site has equipment that measures the water level of the river and several water-quality parameters. These data are recorded electronically every half-hour. Several times a day, the data are uploaded to the USGS Portland office, stored in a database, and made available through a Website (http://or.water.usgs.gov/santiam). These provisional data are immediately available to the agencies involved in the study, as well as to the public. The USGS periodically corrects or deletes the raw data according to routine field checks of the water-quality probes and other calibration or performance issues. The final data are then published in a year-end report.
|
|
|
Multiparameter Water-Quality Probes
Water-quality probes in the North Santiam River Basin measure specific conductance, pH, water temperature, and turbidity. These physical and chemical characteristics are important indicators of the overall health of the aquatic system.
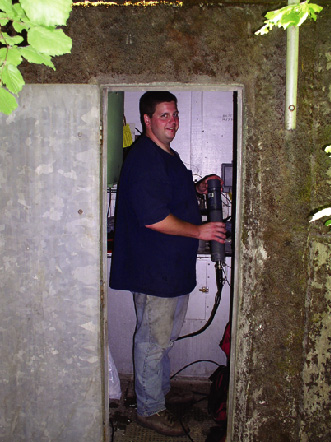
A USGS scientist (at right) calibrates a water-quality instrument at the Breitenbush monitoring station.
|
 |
|
|
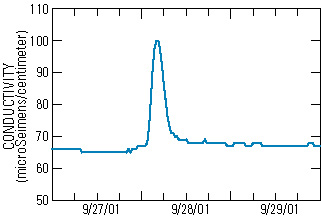
Specific Conductance
Specific conductance is the measure of the capacity of water to conduct electricity at 25 degrees Celsius (°C). A change in conductance signals a change in concentrations of chemical ions in the water. Abrupt conductance deviations may result from chemical spills or sewage overflows entering a stream, lake, or other waterbody.
|
|
A dramatic spike in conductivity appeared in the Breitenbush River (map number 5) over just a few hours. Periods of regularly occurring spikes such as this may lead to an investigation of possible causes of contamination upstream of the monitoring station.
|
|
|
|
|
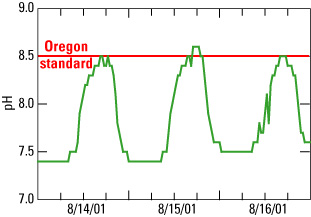
Warm, sunny afternoons result in increased photosynthetic activity from instream algae and rooted aquatic plants. This can be observed in daily variations of pH values at Little North Santiam River near Mehama (map number 2). Summer heat and low-flow conditions can cause pH to exceed the Oregon standard of 8.5.
|
|
pH
pH is the measure of the alkaline or acidic properties of water. Proper pH is important for the survival and abundance of aquatic plant and animal communities, as well as for the aesthetic qualities of drinking water, such as taste, odor, and color.
|
|
|
Water Temperature
Optimal water temperature is important for the survival and vitality of fish and aquatic insect populations. Changes in river temperatures can affect these populations, as well as algal, plant, and amphibian species.
|
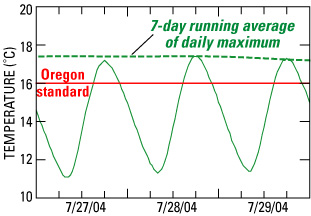
The summer water temperature in the North Santiam River at Mehama (map number 1) sometimes peaks above 16 °C on several consecutive days, potentially exceeding the Oregon standard, which is calculated by averaging the maximum values of the previous 7 days. |
|
|
|
|
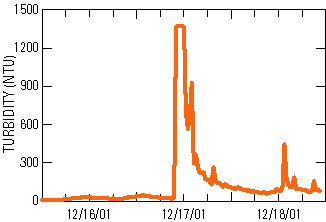
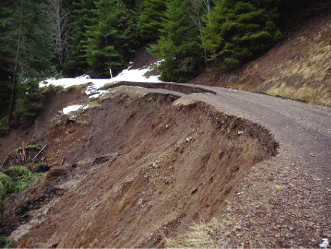
The sudden increase in turbidity at Blowout Creek (map number 7) reached the sensor's maximum value (about 1,350 NTU) in just minutes, gradually dropping after remaining for 2 hours at the sensor limit. A site visit and inspection of the area upstream of the station revealed that a washed-out road and related debris flow resulted in sediment transport, causing increased turbidity (see photograph at the end of this report).
|
|
Turbidity
Turbidity is used as a monitoring and regulatory parameter in the industrial, sanitation, and environmental fields, and can be used as a substitute for suspended-sediment concentration. Elevated turbidity reduces the transparency of water due to the presence of suspended and dissolved materials. Increases in turbidity can reduce biological primary production (algal growth), important to the health and balance of the aquatic ecosystem, and may aid in transporting contaminants attached to suspended particles. Turbidity can be an indicator of water suitability for fishery, drinking, industrial, and recreational uses, and has been used to evaluate the effects of mining, dredging, stream-side construction, wastewater effluent, logging, road building, and other land use activities.
|
|
|
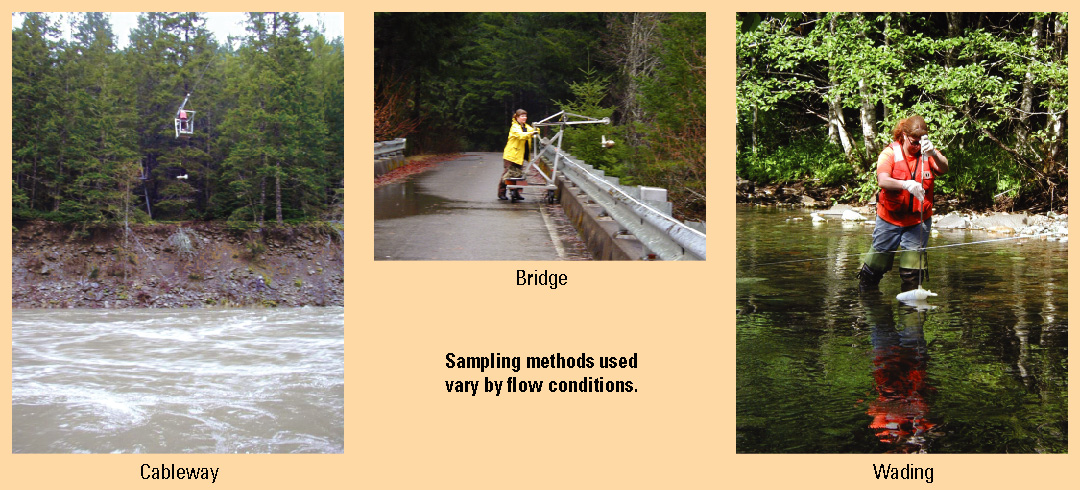 |
Suspended-Sediment Samples
At each of the seven monitoring sites, the USGS collects water samples that are analyzed for suspended-sediment concentration. The USGS adheres to strict quality-assurance and quality-control protocols to assure the reliability of the resulting data. The sampling procedure requires that water be collected across the entire cross-section of the river, ensuring a representative sample. The samples are collected in one of three ways (above): (1) Sites where the river is typically over 3 feet deep have a suspended cableway across the river from which samples are collected. (2) Other sites can be sampled from a bridge. (3) Smaller streams and rivers at low-flow conditions can sometimes be sampled by wading. Each of these sampling methods has equipment designed specifically for the task, including different size and weight samplers, cranes, and reels. Samples are collected at each site on a regular basis and during high-turbidity events. It is particularly important to collect samples during intense precipitation periods that produce high streamflows, since this is when most of the sediment is transported downstream.
|
|
|
Automatic Pumping Samples
When time or personnel constraints make it impossible to sample all seven sites during a high-turbidity event, at night or on weekends, automatic samplers are useful (see below). These devices are programmed to automatically collect suspended-sediment samples under certain conditions. The sampler is positioned on the river bank along with flexible tubing deployed from the sampler into the water. When the turbidity reaches a certain value, the sampler pumps water into bottles stored within it. Unlike manually collected samples, these "point" samples (samples collected at a single point) do not necessarily provide a sediment and water mixture representative of the river cross-section. A correlation must be developed between the cross-sectional samples and point samples by collecting both types at the same time during a variety of flow conditions. Once this correlation is established, the point samples can be used to estimate the suspended-sediment concentration of the river cross section.
|
|
|
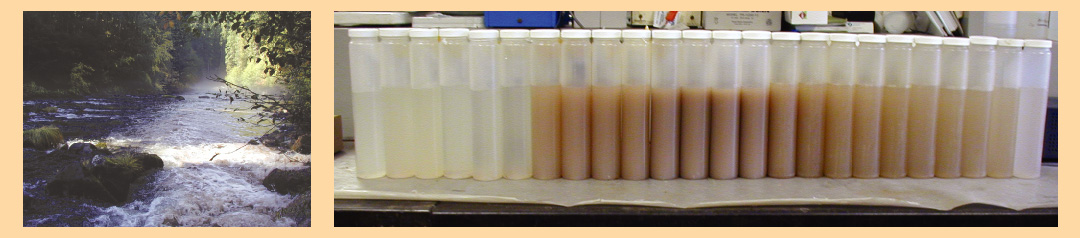
Capturing the Unexpected
On October 21, 2003, the automatic sampler deployed at the North Santiam River near Detroit station was triggered to begin sampling by a sharp rise in turbidity. The turbid water entered the North Santiam River from Pamelia Creek, 11 miles upstream from the monitoring station (photo at left). The sediment plume moved quickly downstream. The automatic sampler collected 24 samples over the 16-hour event. Peak turbidity in these samples exceeded 5,000 NTU (center samples in photograph at right). About 4 hours after the peak, a USGS technician arrived at the site and manually collected a sample, which showed a sharp decrease to 560 NTU. Typically, stream turbidity increases during periods of storm runoff; however, this turbidity event was not associated with rainfall. Glacial melt and related landslide activity on Mount Jefferson were the most likely cause.
|
|
|
Persistent-Turbidity Samples
Another
important aspect of the water quality is "persistent
turbidity." This term refers to material that remains in suspension for a long period of time. Fine silt and clay particles settle through the water more slowly than larger sand particles. A higher percentage of fine material results in more persistent turbidity. Samples are collected at the monitoring sites during high-turbidity events for persistent-turbidity analysis. In the USGS laboratory, the turbidity of these samples is measured at regular time intervals. As the sediment settles, the turbidity near the surface of the water sample decreases. The rate of the decrease depends on the amount of fine material in the sample. These data help to determine the proportion of clays and silts that enter the stream network from each of the monitored watersheds upstream from Detroit Lake.
|

|
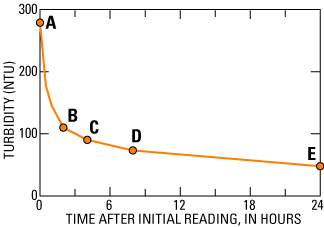
Persistent-turbidity lab analysis begins with a well-mixed sample of water and sediment. Subsamples are collected [at a specific depth from the sample water surface] after approximately 0, 2, 4, 8 and 24 hours of settling time. The turbidity values of these subsamples are then plotted to determine the decrease of turbidity over time. Cylinders A through E demonstrate the results of a typical persistent-turbidity experiment. The graph (top) shows the results of the analysis. Notice how the turbidity decreases over the 24-hour period of settling (cylinder A to cylinder E).
|
|
|
|

|
A USGS scientist collects water samples from Detroit Lake for water-quality analysis.
|
|
Detroit Lake Samples
To better understand the processes of sediment transport through Detroit Lake, the USGS collected lake samples regularly at three locations from April 2002 to October 2003. Samples were collected throughout the water column and analyzed for suspended-sediment concentration and persistent turbidity using the same methods as for the samples from the rivers. The resulting data allow researchers to model the movement of sediment through the lake.
|
|
|
Who Uses the Water-Quality Data?
City of Salem
The USGS water-quality monitoring network serves as an early warning system for Salem's water-treatment facility. During storms, water managers can monitor the major tributaries of the North Santiam River for changes in streamflow and turbidity. The ability to anticipate the arrival of excessively turbid water allows water-treatment facility operators to close water intakes before damage occurs to the sand filters. When the turbidity returns to 10 NTU or less, the intakes are reopened, and water can once again enter the filtration system. During periods of prolonged high turbidity, water is diverted to a pretreatment facility, where chemical pretreatment removes the turbidity-causing material before the water enters the sand filters. This diversion is no longer necessary once the monitors show that turbidity values have stabilized below 10 NTU. Thus, the monitoring network allows the City of Salem to better manage the water-treatment facility and to provide clean water to its customers.
U.S. Geological Survey
The sediment-concentration and other water-quality data collected from Detroit Lake are being used by USGS researchers in a water-quality model of the lake to further the understanding of the overall water quality in the North Santiam River Basin. The model utilizes data from the continuous-monitoring sites on the tributaries in conjunction with the lake data. Streamflow, water quality, and environmental factors are used to describe sediment transport and thermal structure within the lake. This model provides information to the agencies involved in this study, as well as to those studying water quality farther downstream in the Willamette Valley.
U.S. Army Corps of Engineers
The Corps of Engineers relies on streamflow data from the stream-gaging network to manage the water budget of the basin. Accurate water volume input and output values allow them to plan for flood control, flow augmentation, power generation, and recreation. Data from the sampling program will assist the Corps in estimating sedimentation rates in Detroit Lake.
Local Governments, Industry, and the Public
Communities, municipalities, industry, and the general public use the data to make informed decisions about water use, fishing, and other recreational activities.
Land Managers
Turbidity sensors allow the estimation of real-time sediment concentrations at each of the monitored sites. The sediment data can be used to calculate the quantity of suspended material being transported downstream past each monitoring station and to identify the source of the sediment. Knowing which subbasins produce the most turbidity-causing material can aid in the understanding of processes related to glacial activity, landslides, and earthflows, and thus in the management of land use, such as streamside construction, timber harvesting, and road building.
|
|
|
|
Heavy rain in December 2001 triggered a road failure on a tributary of Blowout Creek. The resulting debris flow caused increased turbidity at the monitoring station for several days.
|
|
|
Detroit Lake, January 29, 2004, looking westward from near where the Breitenbush River enters the lake. Note the turbid water entering the lake after more than 3 inches of rain fell over a 3-day period.
|
|
|
|
Working together, the City of Salem, USGS, land managers, and local agencies have developed a water-quality monitoring network that benefits a large segment of Oregon's population. The cooperative relationship has helped foster an environment that balances drinking-water needs, land use and forest activities, and recreation with the maintenance of a healthy ecosystem in the North Santiam River Basin. |
|
|
|
Where can I learn more?
City of Salem Drinking Water Program
555 Liberty St. SE
Salem, OR 97301
http://cityofsalem.net/~swater/
North Santiam River Turbidity Study Website
http://or.water.usgs.gov/santiam
Report: Monitoring Instream Turbidity to Estimate
Continuous Suspended-Sediment Loads and Yields
and Clay-Water Volumes in the Upper North Santiam
River Basin, Oregon, 1998-2000
https://pubs.water.usgs.gov/wri034098
|
U.S. Army Corps of Engineers
Portland District
P.O. Box 2946
Portland, OR 97208
http://www.nwd-wc.usace.army.mil/nwp/
(Use the "dataquery" button to obtain data
for the Willamette River Basin.)
Willamette National Forest
Detroit Ranger District
HC73, Box 320
Mill City, OR 97360
http://www.fs.fed.us/r6/willamette/
U.S. Geological Survey
10615 SE Cherry Blossom Drive
Portland, OR 97216
http://or.water.usgs.gov/
|
|
|
 |