Plant communities are key components of the Greater Everglades. In addition to providing food and shelter to higher trophic level species, plants influence abiotic ecosystem processes such as fires. The hydrologic modifications, proposed as part of the Comprehensive Everglades Restoration Plan (CERP), will affect both the spatial distribution of plants through time and the fire regime. Changes in the local complement of plants can influence the frequency and intensity of fires in a given area through consequent changes in flammability and rates of fuel production. Hydrologic restoration may, therefore, contribute to the restoration of more natural fire patterns by altering the local risk of fire in different areas. Fires also play an important role in shaping the floral landscape. For example, some fires burn soils, lowering local topography and changing local hydrologic patterns. Fires also can result in the establishment of fire-climax communities, and therefore, are capable of altering the local plant community structure and composition.
Understanding the complex interrelationships among these components and processes is an important part of evaluating hydrologic restoration efforts. Under the Across Trophic Level System Simulation (ATLSS) Program, models have been developed for vegetation succession and fire that incorporate the effects of hydrology. These models examine relative differences under proposed hydrologic changes in the: (1) number, diversity, and spatial configuration of Everglades plant communities; and (2) number, size, frequency, and distribution of fires in the Everglades.
The ATLSS vegetation succession and fire models are designed to share a common model area, spatial configuration, land cover map, and hydrologic input. The model area covers most of the natural areas of southern Florida, including the water-conservation areas, Everglades National Park, and Big Cypress National Preserve (fig. 1). Modeling over this entire area presents substantial computational challenges, but is necessary in order to capture the dynamics of an interconnected system and provide an assessment tool in which relations between subregions can be evaluated.
 |
| Figure 1. Boundary of ATLSS modeling region in southern Florida. BCNP is Big Cypress National Preserve, ENP is Everglades National Park, and WCA is Water Conservation Area. |
The model grid is spatially divided into cells representing 500 x 500 m (meter) plots. At this scale of resolution, about 73,000 grid cells are required to cover the ATLSS model area. The vegetation succession model classifies each plot as containing a single vegetation type. Currently, the vegetation types are based on those used by the Florida Gap Analysis Project (FGAP) for the FGAP map (Pearlstine and others, 2002). FGAP is used to initialize the spatial distributions of vegetation in the vegetation succession model.
Hydrologic input for the models is based on the output of the South Florida Water Management Model (SFWMM), which is the standard tool for projecting hydrologic patterns resulting from changes in water management in southern Florida. ATLSS High Resolution Hydrology (HRH) interpolates SFWMM output, provided at a 2-mi (mile) scale of resolution, over a high-resolution topography map to create water depths at a 500-m scale over the model area.
The ATLSS Vegetation Succession Model (VSMod) simulates the pattern of spatial and temporal changes in the distribution of vegetation in the Greater Everglades landscape as a function of the hydrologic regime, patterns of fire disturbance, and nutrients. A primary goal is to quantify the relative differences between various hydrologic scenarios as reflected in their impacts on vegetation succession.
VSMod incorporates a spatially explicit, stochastic cellular automata model to simulate vegetation succession. At any given time, each 500 x 500-meter plot is in one of a finite number of states. The transition between states occurs with a probability that varies in both space and time, dependent on local hydrologic and fire history as well as on the current vegetation. The model runs on a yearly time step, synchronized with the fire model, and produces annual maps of vegetation over the model area.
VSMod rules are based on reports by Wetzel (2001a; 2001b). Three modeled factors influence the succession of one plant association to another: fire, nutrient change, and prolonged change in hydrologic conditions. When hydroperiods increase for 2 consecutive years or decrease for 3 consecutive years, change occurs with a probability between 0 and 1 for each year of continued hydroperiod change. Any interruption in the hydroperiod trend resets the consecutive year count.
The type of vegetation in a plot affects succession by determining hydroperiod ranges for persistence, rate of transition to a new type, fire frequency required for persistence, maximum probability of burning, and time to recover following a fire. Hydroperiod and fire frequency ranges for most herbaceous and forested vegetation types in the model area are presented in table 1 ordered horizontally by the range of hydroperiods and vertically by the range of fire frequencies. Each color represents similar or identical groups of vegetation types. When more than one plant community can occur within a given hydroperiod and fire interval, transitional probabilities are computed based on the proportional aerial representation of plant associations within the model area. Succession can move forward or backward within the scale of possible transitions.
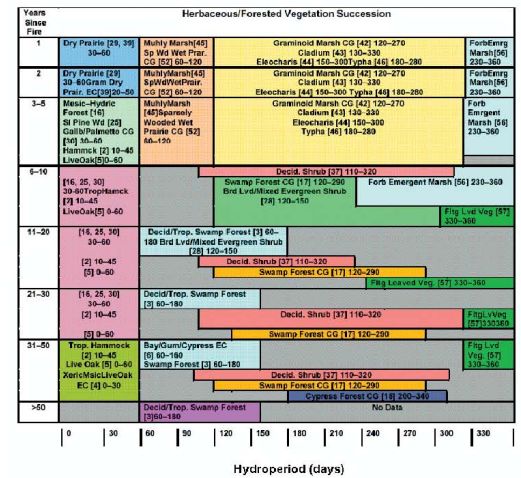 |
| Table 1. Hydroperiod and fire frequency ranges for most vegetation types in the model area [The horizontal axis is the range of hydroperiods (days); the vertical axis is the range of fire frequencies. Numbers in brackets are the FGAP v. 6.6 plant class numbers. Colors indicate similar or identical groups of vegetation types] |
Pending availability of output from more complex nutrient models, the nutrient component of VSMod is based on an empirical relation (Reddy and others, 1993; 1998) that estimates nutrient concentration as a function of distance from water-control structures.
The purpose of the ATLSS fire model is to provide annual estimates of the spatial distribution of areas burned by naturally occurring fires in the Florida Everglades (fig. 2). The ATLSS fire model provides input for the ATLSS vegetation succession model (VSMod), whereas VSMod provides local vegetation information for the fire model, simulating the effects of feedback between fire history and vegetation (fig. 3). The yearly time step of the model ends on May 31, the end of the natural fire season.
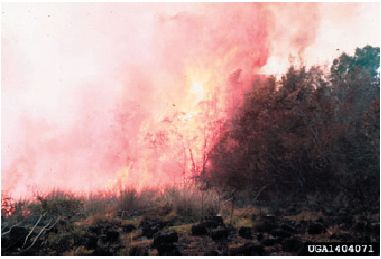 |
| Figure 2. Fire in the pinelands of Everglades National Park, 1974. Photo by Dale Wade, U.S. Department of Agriculture Forest Service, Invasive. org. Used with permission. |
 |
| Figure 3. Proposed relation between time since last fire and probability of burning. In this function the probability is at pmin,v in the first year following a fire, where pmin,v is the minimum probability of burning for vegetation type v. The probability of burning increases yearly until pmax,v is reached, which is the maximum probability of burning for vegetation type v. The parameter TR,v represents the time required to return to the maximum burn probability. |
The ability to input yearly map layers of historical fire distribution has also been incorporated into VSMod to investigate historical patterns of vegetation change. The available data are incomplete, however, lacking information for some regions and time periods, and historical data do not permit projecting fire distributions under alternative hydrologic management scenarios. Historical data can be leveraged to parameterize the fire model, which will be used to estimate the annual area burned across the entire landscape. The model allows future fire conditions to be estimated and the effects incorporated into Everglades restoration planning.
Vegetation information is provided by VSMod, which classifies each plot as containing 1 of 25 natural vegetation types. In the fire model, the 25 FGAP vegetation types are aggregated into five more general groups: grasses, pines, hardwoods, flooded vegetation, and shrubs. All types within a group are assumed to have similar probabilities of burning and are assigned a single group-level maximum and minimum burn probability.
The ATLSS fire model provides estimates of the spatial distribution of both hot and cool fires. Hot fires are those that result in the death of trees and/or the burning of soils and peat material. These fires reset the successional process to "early" vegetation types. Cool fires are those that do not kill trees or burn soils. These fires burn only above-ground portions of plants and arrest succession at different stages of development depending on fire frequency.
The model simulates landscape-scale fire patterns by modeling fire spread as a collection of local stochastic processes. Each plot is represented by a stochastic cellular automata model and is in one of three states: unburned, burned by cool fire, or burned by hot fire. Transitions between these states are stochastic and dependent on local environmental conditions and the presence or absence of fire in the adjacent plots.
The model assumes that all natural fires are caused by lightning strikes. The spatial distribution of area burned for each year is estimated by computing for each plot in the landscape the number of lightning strikes, the probability of burning, and the number of resulting fires. Finally, fire spread is simulated, incorporating a locally determined conditional probability of burning given that a neighboring plot is burning.
We estimate the number of lightning strikes each year during the natural fire season using annual rainfall data based on two empirical relations (Beckage and others, 2003). The first of these relates El Nino Southern-Oscillation (ENSO) to annual winter rainfall in southern Florida, and the other relates ENSO to the annual number of lightning strikes in southern Florida. We then distribute the lightning strikes randomly across the landscape. Each plot that is struck by lightning has a probability of igniting.
The local burn probabilities are determined for each plot based on local environmental conditions including vegetation type, fire history, and hydrology which interact and change through time. Although the range of burn probabilities is determined by vegetation type, the local fire history and hydro-logic conditions determine the specific value within the range. The probability of burning is low in the year following a fire, increasing each subsequent year without fire until the maximum burn probability is reached. Within this chronology, fire probabilities tend to vary inversely with hydroperiod length (fig. 4). The highest probability is associated with short hydroperiods and follows a smooth decrease as the hydroperiod increases. A directional bias incorporates the effect of prevailing winds by modifying local burn probabilities of neighboring plots based on their position relative to a burning plot.
 |
| Figure 4. Proposed relation between hydroperiod (hp) and probability of burning. In this relation, the highest probability is given by pfire,v(t) as obtained from the relation shown in figure 3 and is associated with short hydroperiods. The value pmin,v is the minimum probability of burning for vegetation type v. The values hpmax,v and hpmin,v provide a maximum and minimum hydroperiod preference for vegetation type v. The form of the relation is given by one minus the cumulative distribution function for a normal distribution where 95 percent of the normal distribution is between hpmax,v and hpmin,v. |
The parameters for: (1) maximum and minimum hydroperiod preference for each vegetation type, and (2) the time required to return to maximum burn probability after a fire are assigned values provided by Wetzel and others (2001b). The remaining parameter values for burn probabilities of the five vegetation groups are estimated based on data from Everglades National Park fire records of the date, source of ignition, and area burned by documented historical fires. From these data, we create distributions of fire sizes and frequencies for use in estimating model parameter values.
The current effort has focused on modeling natural fires. However, later versions of the model could incorporate several anthropogenic aspects of fire dynamics, including: (1) managed burns and their effects on succession, and (2) manmade fire breaks, such as airboat trails, which retard fire spread.
Beckage, B.W., Platt, W. J., and others, 2003, Influence of the El Nino southern oscillation on fire regimes in the Florida Everglades: Ecology, v. 84, no. 12, p. 3124-3130.
Pearlstine, L.S., Smith, S., and others, 2002, Assessing statewide biodiversity in the Florida Gap Analysis Project: Journal of Environmental Management, v. 66, p. 127-144.
Reddy, K.R., DeLaune, R.D., and others, 1993, Long-term nutrient accumulation rates in the Everglades: Soil Science Society of America Journal, v. 57, p. 1147-1155.
Reddy, K. R., Wang, W., and others, 1998, Forms of soil phosphorus in selected hydrologic units of the Florida Everglades: Soil Science Society of America Journal, v. 62, p. 1134-1147.
Wetzel, P., 2001a, Plant community parameter estimates and documentation for the Across Trophic Level System Simulation (ATLSS): Accessed at http://www.tiem.utk.edu/~sylv/HTML/Everglades/VSMod-HTML/
Wetzel, P., 2001b, Nutrient and fire disturbance and model evaluation documentation for the Across Trophic Level System Simulation (ATLSS): Accessed at http://www.tiem.utk.edu/~sylv/HTML/Everglades/VSMod-HTML/
For further information contact:
Donald L. DeAngelis
U.S. Geological Survey
Florida Integrated Science Center
Water and Restoration Studies
University of Miami
Coral Gables, FL 33124
ddeangelis@umiami.ir.miami.edu
Scott M. Duke-Sylvester, Louis J. Gross
The Institute for Environmental Modeling
University of Tennessee
Knoxville, Tennessee 37996
This report is available online in Portable Document Format (PDF). If you do not have the Adobe Acrobat PDF Reader, it is available for free download from Adobe Systems Incorporated.
Download the report (PDF, 3.7 MB)
Document Accessibility: Adobe Systems Incorporated has information about PDFs and the visually impaired. This information provides tools to help make PDF files accessible. These tools convert Adobe PDF documents into HTML or ASCII text, which then can be read by a number of common screen-reading programs that synthesize text as audible speech. In addition, an accessible version of Acrobat Reader 5.0 for Windows (English only), which contains support for screen readers, is available. These tools and the accessible reader may be obtained free from Adobe at Adobe Access.
| AccessibilityFOIAPrivacyPolicies and Notices | |
 |
|