
Fact Sheet 2005-3020
March 2005
This factsheet is available as a pdf.
| This Fact Sheet is one in a series that highlights information or recent research findings from the USGS National Streamflow Information Program (NSIP). The investigations and scientific results reported in this series require a nationally consistent streamgaging network with stable long-term monitoring sites and a rigorous program of data quality assurance, management, archiving, and synthesis. NSIP produces multi-purpose, unbiased surface water information that is readily accessible to all. |
The Mississippi River flows southward from Minnesota to the Gulf of Mexico (fig. 1), draining areas as far east as the Appalachian Mountains, as far north as Canada, and as far west as the Continental Divide. Runoff from 31 states drains through the Mississippi to the Gulf. Discharge of the Mississippi River is affected both by climate and by human activities. Understanding these influences, which is key to management of the water in the basin, requires information about the basin hydrology, especially characterization of long-term and seasonal streamflow, including both flood and drought.
 |
| Figure 1. Mississippi River basin with major tributaries and state boundaries. The width of a river indicates its mean water discharge (modified from Circular 1133, Figure 5). |
The flow of the Mississippi River is maintained by runoff of rainfall and snowmelt. However, not all rainfall or snowmelt runs off. Some infiltrates the soil and is subsequently transpired into the atmosphere by plants or evaporates directly into the atmosphere. In total over the basin, evapotranspirative losses consume more than three quarters of the annual precipitation, but these losses vary regionally. In the arid western portion of the basin, very little water is left to run off after evapotranspiration extracts its share; most of the river's flow is runoff from the relatively moist eastern part of the basin (fig. 1). Flow also varies in time corresponding to variability in precipitation and evapotranspiration (fig. 2). For example, in 1988, precipitation was 18 percent below the long-term average [835 millimeters per year (mm/year)] and discharge was 29 percent below the long-term average (187 mm/year). In 1993, however, precipitation was 19 percent above the long-term average and discharge was 52 percent above the long-term average.
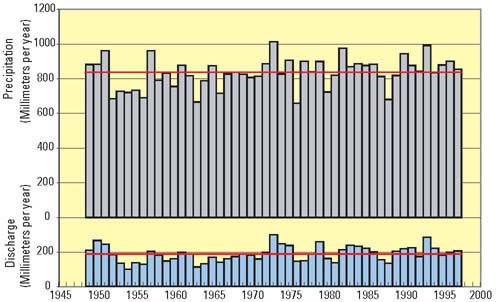 |
| Figure 2. Annual precipitation in and discharge from the Mississippi River basin. The red lines represent long-term mean values of precipitation and discharge. |
The balance between evapotranspiration and runoff is modified, both directly and indirectly, by human activity. The greatest human effect is associated with agricultural irrigation, which is widely practiced in the arid west. The net effect of this activity is to divert water from runoff into evapotranspiration. The second greatest human effect is associated with evaporation of water from the surface of reservoirs. An estimated 6 percent of natural runoff is diverted to evapotranspiration as a direct result of human activity (table 1, (C/E)•100).
Table 1. Major terms in the water balance of the Mississippi River basin, 1949-1997. All flows are expressed as volumes of water per unit area of the basin per year, or equivalently, depths of water per year. Mean flows, as well as rates of change in millimeters per year per decade, obey the following equations: A=B+E; B+C=D; E-C-F+G=H. Some of these equations are not obeyed exactly by the numbers in the table because of rounding. (Data from Milly and Dunne, 2001.)
| Process | Mean | Rate of Change | ||
|---|---|---|---|---|
| (Millimeters per year) |
(Millimeters per year per decade) |
(Percent per decade) |
||
|
A |
Precipitation |
835 |
17.8 |
2.1 |
|
B |
Natural evapotranspiration |
637 |
6.9 |
1.1 |
|
C |
Human-induced evapotranspiration |
12 |
2.6 |
22 |
|
D |
Total evapotranspiration |
649 |
9.5 |
1.5 |
|
E |
Natural runoff |
197 |
10.9 |
5.5 |
|
F |
Runoff lost to fill surface reservoirs |
1 |
-0.5 |
-50 |
|
G |
Net removal of ground water |
2 |
-0.3 |
-15 |
|
H |
Mississippi River discharge |
187 |
8.5 |
4.5 |
The creation of surface-water reservoirs and the development of ground-water resources have led to changes in storage of water inside the Mississippi River basin. During the second half of the 20th century, the discharge of the Mississippi River was about 0.5 percent smaller than it would have been in the absence of extractions to fill surface reservoirs (table 1, (F/H)•100). On the other hand, extraction of water from ground-water storage averted an approximate 1-percent reduction of discharge that would otherwise have been needed to satisfy water users (table 1, (G/H)•100).
The trends over time in various water-budget terms are affected by climate and human activities. During the latter half of the 20th century, the most significant control has been a 2.1-percent per decade upward trend in annual precipitation (fig. 2, table 1). As a result of nonlinearity in natural runoff processes, this upward trend has disproportionately affected runoff, which increased at a rate of 5.5 percent per decade (table 1).
The increase in runoff has been greater than the increase of human-induced evapotranspiration. If runoff rates would have been constant, then the increase of human-induced evapotranspiration would have caused a decrease in discharge, at a rate of about 1 percent per decade.
The rate of filling of surface-water reservoirs changed markedly during 1949-1997, because most reservoirs were filled during the first half of this period. The decreasing rate of storage helped to free up runoff to support the increase of human-induced evapotranspiration. On the other hand, estimated net extraction of ground water also declined, reducing somewhat the availability of water to support use and discharge.
Trends are history; they cannot be extrapolated confidently to forecast the future. In the Mississippi River basin, research (Milly and Dunne, 1998) indicates that much of the observed upward trend in precipitation may have been a manifestation of natural variability. Thus, the upward trend will not necessarily be sustained into the future. Cessation or reversal of the trend would decrease flows through the basin, thus having consequences for water supply.
Superimposed upon natural variability may be changes in precipitation associated with anthropogenic climate change. Such trends during the coming decades are not expected to be as large as the recent precipitation trends in the basin. However, their direction is unknown. On the other hand, in contrast to changes driven by natural variability, these changes may be cumulative and sustained.
Toward the end of the 20th century, the rate of increase of water use and associated human-induced change in evapotranspiration slowed or stopped. If water use were to stabilize in the future, then further increases in runoff would not be needed in order to maintain the rate of discharge.
For additional information, contact:
P.C.D."Chris" Milly
U.S. Geological Survey
GFDL/NOAA
P.O. Box 308
Princeton, NJ 08542
(609) 452-6507 cmilly@usgs.gov
Milly, P.C.D., and Dunne, K.A., 2001, Trends in evaporation and surface cooling in the Mississippi River basin: Geophys. Res. Lett., v. 28, p. 1219-1222.
Milly, P.C.D., and Dunne, K.A., 1998, Non-detectability of 20th-Century trends in river discharge from large basins--observational and model-based results. In Ninth Symposium on Global Change Studies and Namias Symposium on the Status and Prospects for Climate Predication, American Meteorological Society, p. 162-163.
This factsheet is available online in Portable Document Format (PDF). If you do not have the Adobe Acrobat PDF Reader, it is available for free download from Adobe Systems Incorporated.
Download the report (PDF,107KB)
Document Accessibility: Adobe Systems Incorporated has information about PDFs and the visually impaired. This information provides tools to help make PDF files accessible. These tools convert Adobe PDF documents into HTML or ASCII text, which then can be read by a number of common screen-reading programs that synthesize text as audible speech. In addition, an accessible version of Acrobat Reader 5.0 for Windows (English only), which contains support for screen readers, is available. These tools and the accessible reader may be obtained free from Adobe at Adobe Access.
| AccessibilityFOIAPrivacyPolicies and Notices | |
 |
|