
Simulated Effects of the Proposed
Sulphur
Gulch Reservoir Operations on Colorado
River Quantity
and Quality
Fact Sheet 2005-3031By M.J. Friedel
Available from the U.S. Geological Survey, Branch of Information Services, Box 25286, Denver Federal Center, Denver, CO 80225, USGS Fact Sheet 2005-3031.
This document also is available in pdf format: ![]() FS2005-3031 (847 KB)
FS2005-3031 (847 KB)
(Requires Adobe
Acrobat Reader)
The citation for this report, in USGS format, is as follows:
Friedel, M.J., 2005, Simulated Effects of the Proposed Sulphur Gulch Reservoir
Operations on Colorado River Quantity and Quality: U.S. Geological Survey
Fact Sheet 2005-3031, 4 p.
Introduction
The U.S. Geological Survey (USGS), in cooperation with the Northern Colorado Water Conservancy District (Northern) and Denver Water (Denver), began a study in 2001 of the amount of water available for storage in the proposed Sulphur Gulch reservoir and the effects that reservoir operations might have on dissolved-solids concentrations (herein referred to as "salinity") in the Colorado River under four reservoir-operating scenarios. The proposed 16,000-acre-foot reservoir would be located about 25 miles east of Grand Junction, Colo., on a tributary of the Colorado River that drains the Sulphur Gulch watershed between De Beque and Cameo, Colo. (fig. 1). Denver and Northern are considering building the reservoir to augment streamflows by as much as 300 cubic feet per second (ft3/s) during critical low-flow conditions in the fall, and possibly also during the peak spring runoff, to increase flows for endangered fish as recommended by the U.S. Fish and Wildlife Service (1999). Water would be pumped from the Colorado River, when available, to fill the reservoir at a rate of 150 ft3/s, during times that releases are not occurring.
This fact sheet summarizes a detailed report of the study (Friedel, 2005), including an overview of the modeling approach and simulated effects of reservoir operations on the amount of water available for storage in the proposed Sulphur Gulch reservoir and salinity of the Colorado River at the Government Highline Canal and Grand Valley Irrigation Canal diversions. In the study, a stochastic model was used that takes into account the random and uncertain nature of the quantity and salinity of hydrologic variables (such as streamflow, runoff, evaporation, canal diversions, and reservoir storage) and provides results as a probable range of values for the hydrologic variables and salinity that would result from the reservoir operations. The model provides an understanding of the likely effects of operation of the reservoir that accounts for the day-to-day and year-to-year uncertainty and variability in Colorado River streamflow and salinity, quantity and salinity of runoff from the Sulphur Gulch watershed, and evaporation from the proposed reservoir.
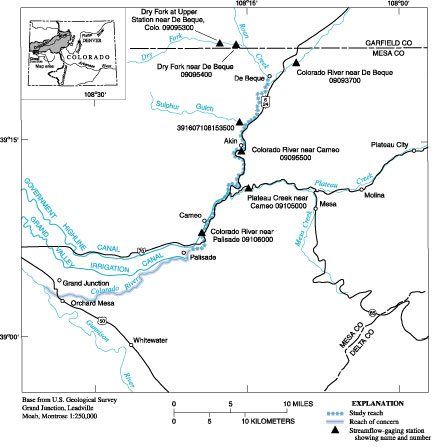 |
| Figure 1. Location of study area between De Beque and Palisade, Colorado. |
Description of Model
The model uses linked hydrology and water-quality components that account for water rights and incorporate the random variability and uncertainty of hydrologic variables and salinity. The hydrology component of the model is used to compute probable flows at key hydrologic points in the study reach that are used by the water-quality component. The water-quality component of the model computes the probable salinity at points where water enters or leaves the study reach. The model incorporates the day-to-day and year-to-year variability and uncertainty in the actual measurement of hydrologic variables and salinity and computes the distribution of probable changes in hydrologic variables and salinity using the Monte Carlo method (Kalos and Whitlock, 1986).
Overall, the model is a simplified representation of the Colorado River-Sulphur Gulch system as shown in figure 2. Salinity is the water-quality variable used in the model. Salinity is considered to be conservative; that is, the dissolved solids that make up salinity are expected to remain in the dissolved form as water is mixed and evaporated. The estimated salinity of water that would be released to the Colorado River from Sulphur Gulch reservoir is the result of mixing water pumped to Sulphur Gulch reservoir from the Colorado River with runoff to the reservoir from the Sulphur Gulch watershed. Increases in salinity due to evaporation from the reservoir surface are included in the estimate.
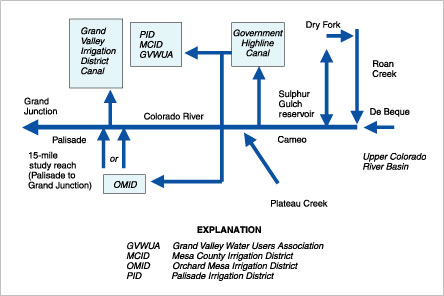 |
| Figure 2. Schematic of the primary study reach hydrologic components. |
Streamflow Quantity Simulations
The model was used to understand the quantity of water available for storage in and release from Sulphur Gulch reservoir based on a set of four reservoir-operation scenarios (table 1). In simulation of these scenarios, pumping as much as 150 ft3/s of Colorado River water to Sulphur Gulch reservoir was allowed throughout the year, except during reservoir-release periods. Pumpage was limited by water availability, taking into account demands of downstream water rights. The initial simulations included estimating the amount of annual divertible flow, annual pumpable flow, storage by season, and storage by day. Carryover of storage in Sulphur Gulch reservoir from year to year was included in all model simulations. Simulations of divertible flow, the amount of water available for diversion from the Colorado River to Sulphur Gulch reservoir after taking into account demands of downstream water rights indicated that divertible flow would range from 621,860 acre-feet of water in the driest year to 4,822,732 acre-feet of water in the wettest year. Because of the planned pumping capacity of 150 ft3/s, pumpable flow (the amount of streamflow available after considering the pumping constraints on divertible flow) would be less than divertible flow. However, the pumpable flow still would be sufficient to fill a 16,000-acre-foot reservoir every year.
Reservoir Operation Scenarios
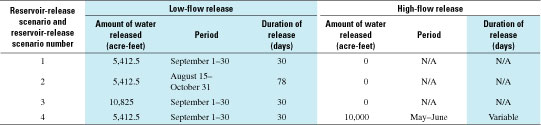
The proposed reservoir is planned to provide (1) at least
5,412.5 acre-feet per year of water to the Colorado River during low-flow
conditions to meet the East Slope's portion of the 10,825 acre-feet of
water required under the December 20, 1999, Final Programmatic Biological
Opinion (PBO) for endangered fish in the Upper Colorado River (U.S. Fish
and Wildlife Service, 1999), and (2) as much as 10,000 acre-feet per year
to enhance high streamflows (when streamflows are in the range of 12,900
to 26,600 ft3/s) to scour the riverbed surface and replicate the natural
hydrograph. Table 1 summarizes the four reservoir-release scenarios that
were simulated.
| Table 1. Summary of reservoir-release scenarios simulated. |
 |
Water-Quality Simulations
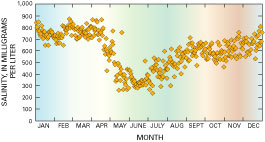 |
| Figure 3. Stochastic simulation of salinity in the Colorado River (09095500) near Cameo, Colorado. |
Water-quality simulations were conducted to understand the probable effects that reservoir pump-and-release operations would have on Colorado River salinity at the downstream diversion points of the Government Highline Canal and Grand Valley Irrigation Canal. This analysis began with a review of the simulated salinity profile at the Cameo streamflow gage prior to the beginning of any reservoir operations (background salinity). An example of one of many likely annual background salinity profiles (fig. 3) indicates that the general shape of the profile has high and relatively stable concentrations in winter, rapidly declining concentrations during spring runoff, and slowly rising concentrations after the snowmelt-runoff peak in the summer and continuing into the fall. The simulated background salinity for a range of hydrologic conditions at the Government Highline Canal during low-flow and high-flow release periods is shown in figure 4. The background salinity during both release periods is larger in dry years than in wet years, and the range of probable salinity (the difference between minimum and maximum values) also is larger in dry years than in wet years. The simulated background salinity at the Grand Valley Irrigation Canal is very similar to that shown for the Government Highline Canal in figure 4 during both release periods. The simulated background salinity provides a basis to compare simulated probable salinity at the two diversions with Sulphur Gulch reservoir operations in place. As a point of reference, the changes were compared to the 3 percent margin of error in the measurement of salinity (Fishman and Friedman, 1989).
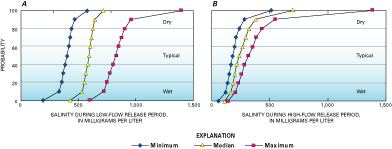 |
| Figure 4. Probability distributions of simulated background salinity at the Government Highline Canal during (A) the low-flow release period, and (B) the high-flow release period. Probability values of 0, 50, and 100 percent represent the wettest, typical, and driest hydrologic conditions simulated. |
Based on simulations of reservoir operations, probable percent changes in salinity at the Government Highline Canal and Grand Valley Irrigation Canal diversions were determined and are shown for reservoir release scenario 4 in figure 5. In general, low-flow releases resulted in probable changes to salinity ranging from slight decreases (less than 3 percent) to slight increases (less than 3 percent) over the range of hydrologic conditions simulated, except for maximum probable salinity changes at the Grand Valley Irrigation Canal during the driest 10 percent of years simulated. Similar patterns of percent change in probable salinity occurred for reservoir release scenarios 1-3, although the changes for maximum probable salinity were greater than 3 percent higher during some hydrologic conditions. During the high-flow release period, the probable changes in salinity were less than 10 percent except for maximum probable salinity increases at the Government Highline Canal during the driest 10 percent of years simulated. Although maximum changes sometimes exceeded the 3 percent measurement error for all release scenarios, median changes greater than the 3 percent measurement error only occurred in the single driest of 1,500 simulations for release scenario 3. Also, maximum probable salinity changes during the driest years at the Government Highline Canal are generally less than those at the Grand Valley Irrigation Canal during the low-flow release period, whereas maximum probable salinity changes during the driest years at the Government Highline Canal are generally greater than those at the Grand Valley Irrigation Canal during the high-flow release period.
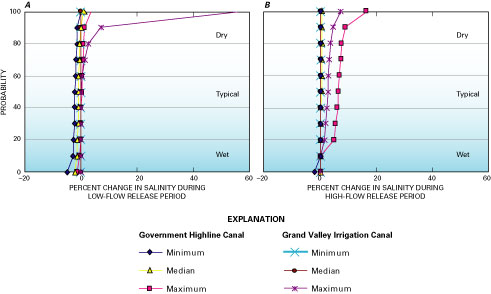 |
| Figure 5. Probability distributions of simulated percent change in salinity following Sulphur Gulch reservoir operations scenario 4 at the Government Highline Canal and Grand Valley Irrigation Canal diversions during the (A) low-flow, and (B) high-flow release periods. Probabilities of 0, 50, and 100 percent represent the wettest, typical, and driest hydrologic conditions. |
Conclusions
Simulations of the Colorado River-Sulphur Gulch system with year-round pumping of Colorado River water to the proposed Sulphur Gulch reservoir and carryover storage in the reservoir indicate that there is sufficient flow available in the Colorado River to refill the proposed Sulphur Gulch reservoir to capacity each year. This holds true even following peak-flow releases of as much as 10,000 acre-feet and low-flow releases of 5,412.5 acre-feet of water regardless of the hydrologic condition and with taking downstream water rights into account, given the proposed pumpage and release capacities of the reservoir. Simulations also indicate that, with the exception of the single driest of 1,500 simulations, the probable annual median change in salinity caused by the proposed operation of Sulphur Gulch reservoir is less than the measurement error for salinity at the diversion points of the Government Highline Canal and Grand Valley Irrigation Canal, although maximum probable changes in salinity could be larger than the measurement error during some hydrologic conditions. Therefore, based on this analysis, operations of the proposed Sulphur Gulch reservoir would have little effect on water quality at the Government Highline Canal and Grand Valley Irrigation diversions under most hydrologic conditions.
References Cited
Fishman, M.J., and Friedman, L.C., eds., 1989, Methods for determination of inorganic substances in water and fluvial sediments: U.S. Geological Survey Techniques of Water-Resources Investigations, book 5, chap. A1, 566 p.
Friedel, M.J., 2005, Stochastic modeling of the effects that the proposed Sulphur Gulch reservoir may have on Colorado River quantity and quality near Grand Junction, Colorado: U.S. Geological Survey Science Investigations Report 2004-5253, 54 p.
Kalos, M.H., and Whitlock, P. A., 1986, Monte Carlo methods: New York, John Wiley and Sons, Inc., 186 p.
U.S. Fish and Wildlife Service, 1999, Final programmatic
biological opinion for Bureau of Reclamation's operations and depletions,
other depletions, and funding and implementation of recovery program actions
in the Upper Colorado River above the confluence with the Gunnison River,
December 1999, (http://www.r6.fws.gov/crrip/biological.htm).
For More Information
Information on technical reports and hydrologic data related to Sulphur Gulch can be obtained from:
Director,
Colorado Water Science Center
Water Resources Discipline
U.S. Geological Survey
P.O. Box 25046, MS 415
Lakewood, CO 80225
303-236-4882
http://co.water.usgs.gov
April 2005
