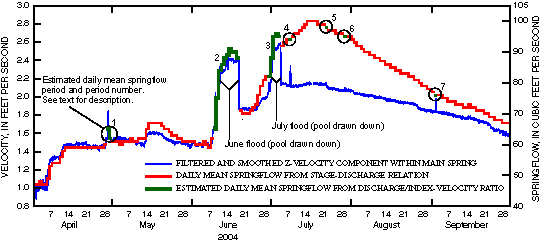
Figure 4. Comparison of z-component of velocity within Main Spring, daily mean springflow derived from stage-discharge relation, and estimated daily mean springflow for 08155500 Barton Springs at Austin, Texas, April 1–September 30, 2004.
Back to Contents | Back to Text | Figure 5