By Peter G. Griffiths, Richard Hereford, and Robert H. Webb
The Mojave Desert spreads across eastern California, southern Nevada, southwest Utah and northwest Arizona (Fig. 1). Since the 1950s, the population in and around the Mojave Desert has dramatically increased, and with it recreational, grazing, mining, military, and other activities. The federal agencies that serve as caretakers are often faced with difficult decisions as they work to ensure that the diverse and fragile ecosystem survives in the face of increasing land use. The first step in making sound management decisions is to understand the desert′s ecological systems, including the processes that shape the geomorphology, or surface features, of the desert landscape.
|
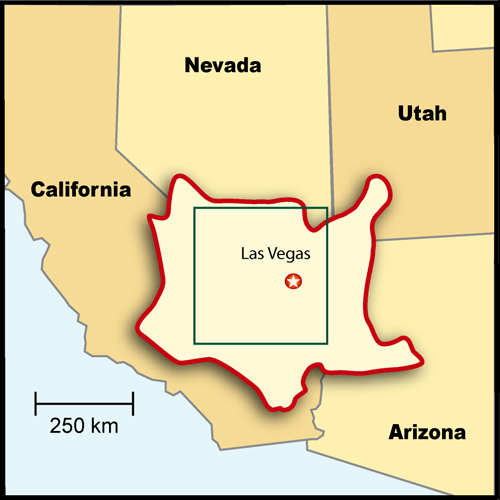
| Figure 1. The study area (Fig. 3, outlined in green) is within the Mojave Desert (outlined in red), which covers 25,000 square miles. Elevation in the Mojave Desert ranges from below sea level in Death Valley to over 1,600 m. Precipitation is between 65 and 190 mm annually, most of which falls during the winter season. |
One measure of geomorphic activity is sediment yield, which is defined as the amount of sediment per unit area removed from a watershed by flowing water during a specified period of time. Changes in sediment yield can signal changes in many elements of the desert ecosystem, including rates of weathering and erosion, climate, and human activity. Sediment yield affects rates of soil development and influences the recovery of disturbed surfaces downslope from source areas in desert landscapes. Sediment yield is strongly affected by surficial materials, topography, rainfall seasonality, and vegetation cover and can be increased by soil disturbance, which often occurs as the result of land use. Sediment yield from small arid basins, particularly in the Mojave Desert, is largely unknown owing to the ephemeral nature of desert streams and the long time intervals between flow events.
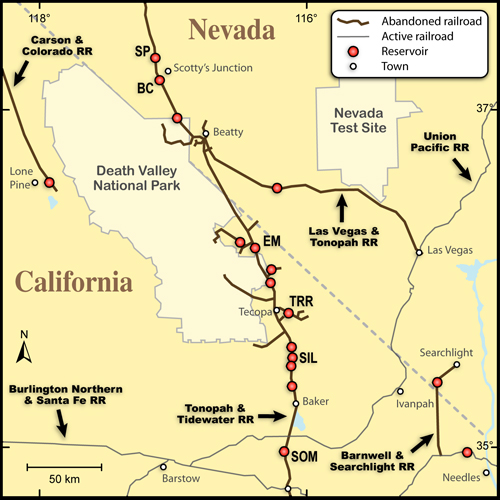
Numerous railroads built in the early twentieth century to serve mining camps in the Mojave Desert provide a unique opportunity to measure recent rates of sediment yield. These railroads cross thousands of washes, but only the most prominent watersheds were given adequate drainage. In some cases, the railbed dammed small watersheds to create artificial reservoirs (Fig. 2). We identified numerous small reservoirs of this type (Fig. 3), where all sediment eroded from the upstream watershed has been trapped behind the railbed. Most of these railroads were built between 1906 and 1910, and sediment in them preserves nearly a century of sediment-yield history in the Mojave Desert.
|
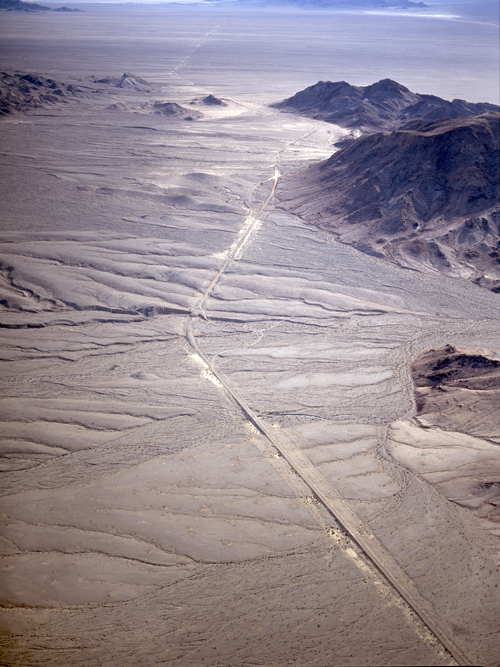
| Figure 2. Aerial view of the former Tonopah and Tidewater Railroad in Valjean Valley. Several small reservoirs appear as light-colored areas upslope (to the left) of the railroad bed. Photograph by M.P. Collier. |
|
| Figure 3. Small reservoirs examined for sediment yield and runoff frequency history plotted along abandoned railroad beds. |
Calculation of sediment yield requires measures of the area drained, the volume (or mass) of sediment removed, and the time interval over which deposition has occurred. Drainage area was calculated by integrating GPS coordinates collected along the boundary of each drainage basin. The volume of sediment captured in each reservoir was calculated by sampling the depth of the deposit with a soil augur at 1- to 2-meter intervals and integrating the results across the area of the reservoir. The time interval of deposition was defined by the date of railway construction and either 1993, when some basins breached during regional flooding, or 2000-2001, when the stratigraphic analyses were performed.
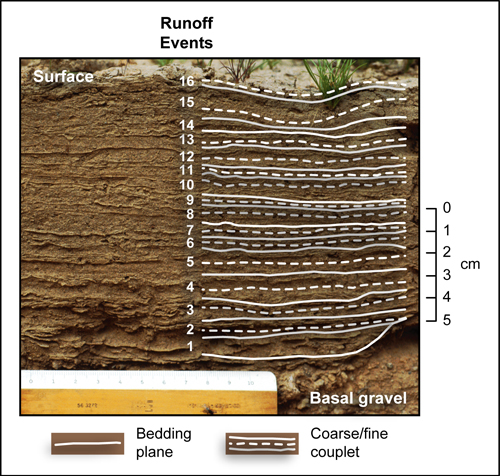
Another useful measure of geomorphic activity is runoff frequency, defined as the number of streamflow events that occur in a watershed over a given time interval. This measure is often expressed as a recurrence interval (RI), the average number of years that occur between flood events. Runoff frequency is closely associated with the pattern of local precipitation, and changes in frequency can reflect changes in vegetation, land use, or climate. Runoff frequency can also be a major determinant of sediment yield. Runoff events were evaluated in 18 reservoirs by examining the stratigraphy and sedimentology of the deposits exposed in the walls of small pits (Fig. 4). In most of the reservoirs, individual flood deposits were distinguishable as couplets of sediment grading upward from silty-sand to silty-clay. Couplets as thin as 2 mm were identified (Fig. 5). The recurrence interval of sediment-depositing floods for each reservoir was calculated by dividing the lifespan of the reservoir by the number of distinct flood strata. The sediment record can be considered censored data in that it records only those streamflow floods of sufficient magnitude to deposit sediment in the reservoir. The smallest runoff events are not recorded.
|
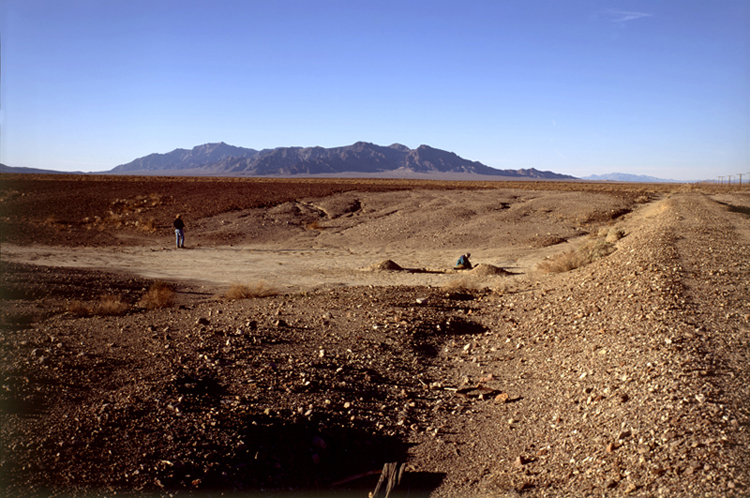
| Figure 4. The small reservoir at the Eagle Mountain (EM) site, along the Tonopah and Tidewater Railroad. The abandoned railbed is on the right. |
|
| Figure 5. Stratigraphic section of reservoir deposits at the Silurian 3 (SIL) site showing runoff events represented by 16 coarse-fine couplets. |
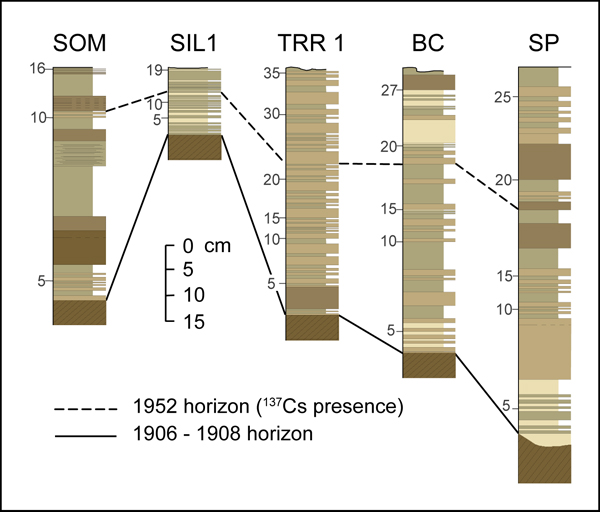
In order to evaluate changes in flood frequency over the last century, the span of time represented by the reservoir deposits must be broken into shorter time intervals. This additional control on the age of deposits was obtained by sampling and analyzing reservoir strata for the presence of cesium-137 (137Cs) which is an anthropogenic isotope created as a by-product of nuclear fission. Introduction of 137Cs to the global environment as fallout began in 1952 when large amounts of 137Cs were injected into the stratosphere by the above-ground testing of high-yield nuclear weapons. Virtually all sediment exposed to fallout after 1952 contains detectable amounts of 137Cs, even if the sediment has been subsequently eroded, transported, and redeposited. 137Cs has been used extensively as a temporal marker in very young stream and lake deposits. Based on the absence or presence of 137Cs, individual reservoir strata were separated into pre- and post-1952 periods, respectively, and flood frequency measures were calculated for each period (Fig. 6).
|
| Figure 6. Stratigraphic cross section showing sedimentology and correlation of reservoir alluvium along a 284-km north-south transect. 137Cs is present in strata deposited after 1952. Cumulative number of runoff events is indicated to the left of each column. |
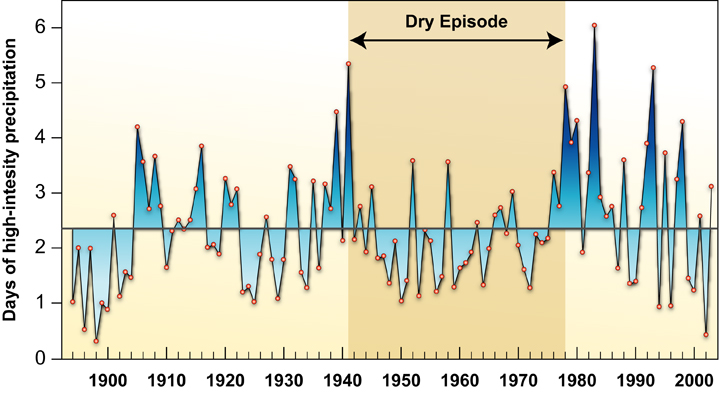
Streamflow recurrence intervals were calculated for 14 reservoirs and ranged from 2.6 to 7.3 yrs with an average of 4.7 yrs. Comparing pre-and post-1952 deposits, the average RI increased from 4.6 to 6.4 yrs, reflecting a decrease in the frequency of sediment-depositing floods in the second half of the 20th century. The decrease in runoff frequency may be related to concurrent changes observed by Hereford et al. (2004) in the regional precipitation regime: a shift from a wet period (1905 through 1941) to a dry period (1942 to 1978) known as the mid-century drought. This change was characterized by a reduction in the frequency of high-intensity precipitation (Fig. 7). Storm intensity is likely a good indicator of sediment deposition because of the censored nature of the preserved deposits. Although the frequency of storms and flow events may not have decreased, the reduced storm intensity probably reduced the frequency of higher magnitude floods, which are more likely to deposit sediment in the reservoirs.
|
| Figure 7. The average frequency of precipitation events on days of high-intensity precipitation shows a dry episode from 1942 to 1978. (High intensity is defined as precipitation > 90th percentile of all measurable daily precipitation at a station. Analysis is based on data from 52 weather stations.) |
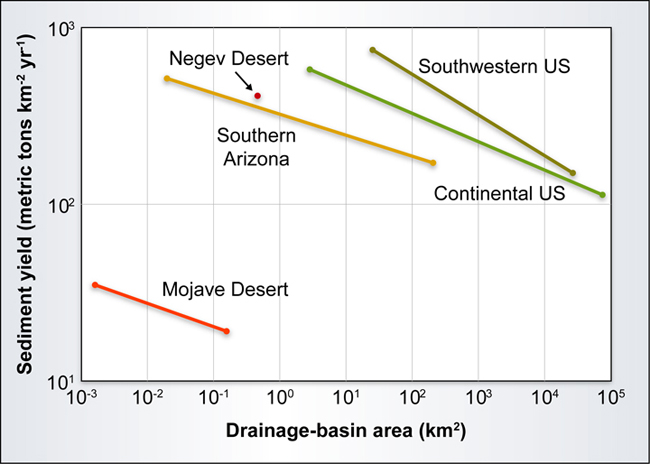
Sediment yield at 15 reservoirs for the entire period of record averaged 28 metric tons km-2 yr-1, an order of magnitude smaller than sediment yields calculated for other regions (Fig. 8). This is not explained by variation in levels of precipitation; a similarly-sized, extremely arid watershed in the southern Negev Desert of Israel generates much more sediment (Fig. 8). The difference may be the result of storm types. Precipitation in the Negev is often generated by intense, localized thunderstorms, while most of the Mojave′s precipitation results from lower-intensity winter storms that are likely less erosive. Sediment yield from the Mojave basins may also be limited by the gentle gradient of the sampled watersheds, as well as the presence of coarse particles or desert pavements that protect most of the watershed surfaces and limit erosion.
|
| Figure 8. Graph showing the relation between sediment yield and drainage area for drainage basins in five different locations. Note that the Mojave Desert drainage basins generate an order of magnitude less sediment per unit area than basins elsewhere. |
In general, sediment yield from the Mojave basins decreased as drainage area increased, a trend typical of larger drainage basins in a variety of climatic and geologic settings (Fig. 8). Small drainage basins are usually topographically simple, and moving sediment the short distance required to exit the basin is a straightforward process. Sediment yield from small basins is typically supply-limited, meaning it is limited primarily by the supply of sediment, and sediment yield increases as a function of drainage basin area. As drainage basins increase in area and become more topographically complex, sediment yield often becomes transport-limited, meaning that sediment yield is restricted by the increasingly complex process of moving sediment out of the basin. For example, sediment eroded from steep headwaters can become trapped in flat bottomlands and increasingly complex drainage networks, which tend to grow more quickly than the headwaters as drainage area increases. Sediment trapping can also occur as water percolates out of the channel network and down into the basin substrate, a process known as transmission loss. Transmission losses will result in reduced streamflow and a decreased ability to transport sediment.
The inverse relation between sediment yield and drainage area exhibited by the Mojave basins suggests that, like larger drainage basins elsewhere, these basins are transport-limited. Sediment-transport limitations such as channel storage and transmission losses may be enhanced by the low slope and coarse substrate of these particular alluvial fans. These limitations would also have a strong effect on the low-discharge, long-duration flood events generated from the low-intensity winter storms that characterize the Mojave Desert precipitation regime.
This work was funded as part of the Recoverability and Vulnerability of Desert Ecosystems Project (RVDE) of the Priority Ecosystem Studies of the U.S. Geological Survey. RVDE is an inter-disciplinary partnership designed to develop a comprehensive understanding of the physical and biological processes that influence the desert′s vulnerability to disturbance and ability to recover. USGS scientists are creating maps, compiling existing scientific information, performing field and lab analyses, and are using the results to create decision-support tools designed to aid land managers.
Griffiths, P.G., Hereford, R., and Webb, R.H., 2006, Sediment yield and runoff frequency of small drainage basins in the Mojave Desert, U.S.A.: Geomorphology 74:232-244.
Hereford, R. Webb, R.H., and Longpré, C.I., 2004, Precipitation history of the Mojave Desert region: U.S. Geological Survey Fact Sheet 117-03, 4 p.
| AccessibilityFOIAPrivacyPolicies and Notices | |
 |
|