Fact Sheet 2006–3042

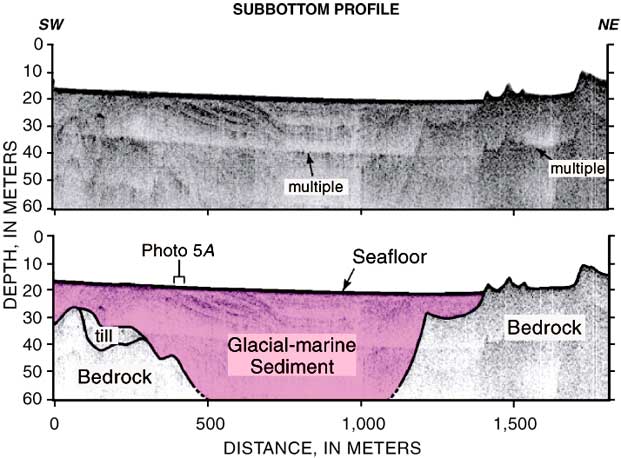
SUBBOTTOM PROFILE Subbottom Profile. The upper diagram is the original data and the lower diagram is an interpreted section showing the geometry and thickness of sediment deposits that lie at or beneath the seafloor. The vertical axis represents the depth below the sea surface, and the horizontal axis the distance traveled while collecting these data. Arrows labeled "multiple" indicate artifacts in the data, not actual layers. A subbottom profile is analogous to a slice of cake, showing the layered internal structure of materials that compose the seafloor. The profile crosses a bedrock-framed valley filled with thick glacial-marine sediment (pink), which is locally exposed on the seafloor (photo in figure 5A). Surficial sediment is thin to absent on the right side of the profile, where bedrock is exposed at the surface. This profile is represented by the black line in figure 4.
This figure consists of two diagrams that show the original subbottom profile (above) and an interpretative section (below). Scale bars on both diagrams show the depth beneath the seafloor on the vertical axis, and the distance along the seafloor on the horizontal axis. The original profile uses grayscale colors to depict the layered sediment beneath the ocean floor. The lower diagram uses light purple tones to show thick glacial-marine sediment filling a depression with bedrock flanking it on both sides.