Fact Sheet 2006–3042

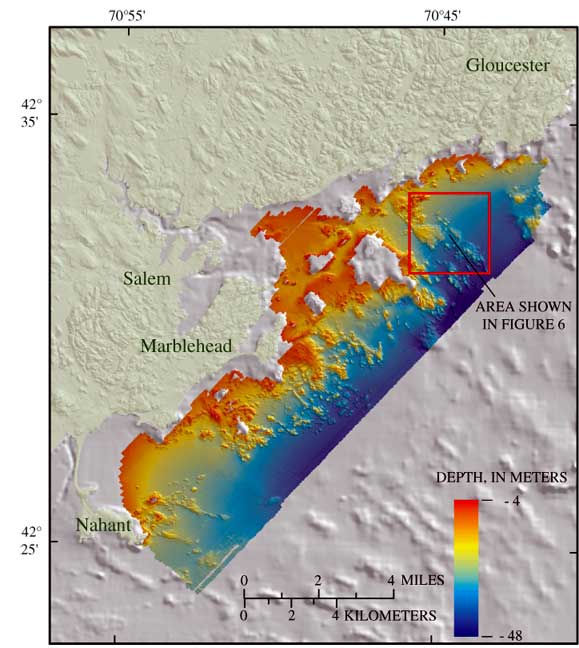
Figure 2. Map of seafloor topography. Bathymetric sonar collects soundings of water depth in a wide swath beneath the ship. Depth is color-coded with reds and oranges indicating shallow water, and blues and greens indicating deeper water. These data show the detailed shape of the seafloor, resolving high-relief, bouldery deposits such as moraines and drumlins formed by glaciers that scoured the region during the last Ice Age. The box indicates the location of data layers shown in figure 6.
A shaded relief map showing the bathymetry offshore of the Massachusetts coast from Gloucester to Nahant. The map uses colors to indicate water depth, with red for shallow water 4 m deep and blue for deeper water 48 m deep. Areas near the shoreline and around islands are mostly red, and areas farther offshore are mostly blue. A red box indicates the location of GIS data layers shown in Figure 6.