Fact Sheet 2006–3042

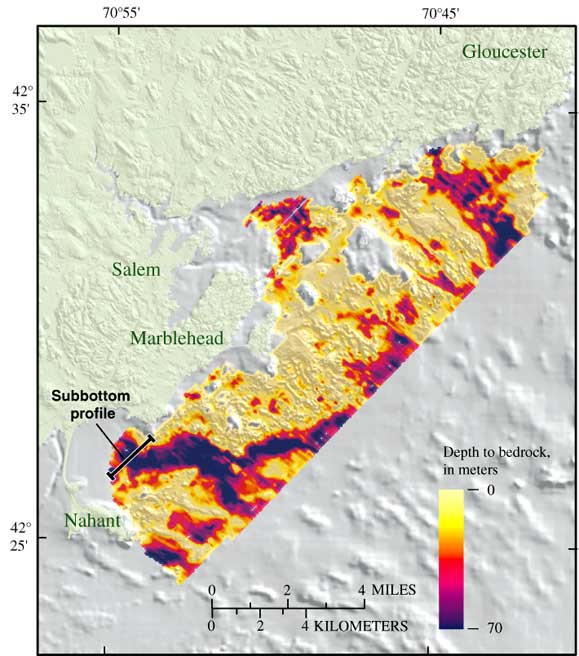
Figure 4 . Map of sediment thickness. A subbottom profiler provides information on the thickness and origin of sediment deposits. The map is based on a closely spaced grid of data produced by a series of subbottom profiles like that in the SW–NE profile shown on the previous page. Yellow tones represent thin or absent sediment cover; purple tones represent relatively thick sediment. The elongate purple feature (lower left) represents thick sediment deposits filling a bedrock valley.
A shaded relief map that is overprinted with an image depicting sediment thickness on the seafloor from Gloucester to Nahant, Massachusetts. The thickness of sediment overlying bedrock is shown in colors — from yellow indicating 0 m to purple indicating 70 m. Most of the area has little or no sediment covering the seafloor, and is shown as yellow and light tones. Thick sediment deposits lie offshore of Nahant and are shown in purple and dark colors. A black line crosses this area of purple and indicates the location of the subbottom profile described in the next image.