Fact Sheet 2006–3042

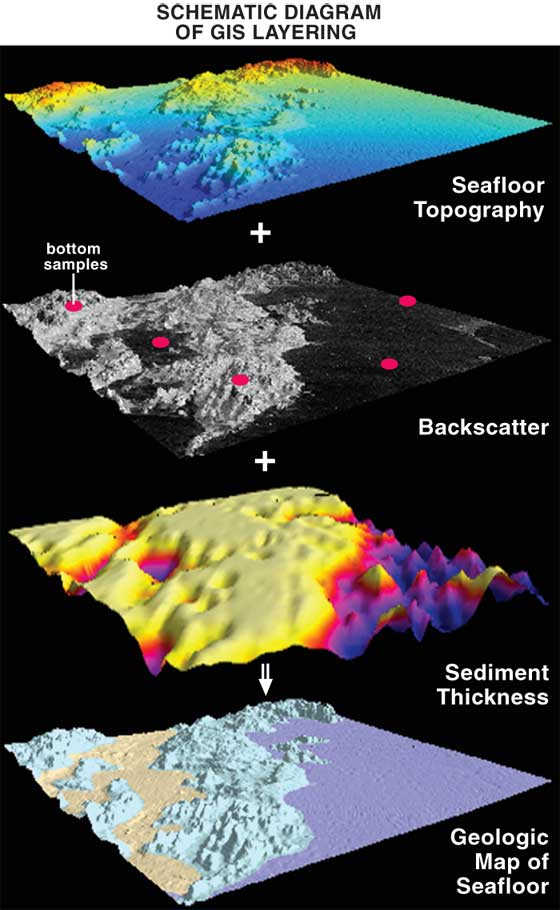
Figure 6. Data layers within a geographic information system, from top to bottom: seafloor topography, backscatter and bottom samples, sediment thickness, and interpretive geologic map. The top three layers and other derived data such as seafloor slope were compiled to support the regional interpretation of seafloor geology (bottom layer) that appears in figure 7.
This schematic diagram shows four GIS layers, each covering the same area of seafloor and superimposed on a relief map. The top layer shows the seafloor topography using red colors to depict shallow water and blue colors to depict deep water. The second layer shows backscatter in gray scale and the locations of 5 bottom samples with red circles. The third layer shows sediment thickness using yellow colors to depict thin deposits and blue colors to depict thick deposits. Combining these three layers results in the fourth layer, a geologic map that shows different map units in yellow, light blue, and purple.