Fact Sheet 2008–3016
1ASRC Research and Technology Solutions, contractor to the U.S. Geological Survey Earth Resources Observation and Science (EROS) Center. Work performed under contract 08HQCN0007.
2Science Applications International Corporation, contractor to the U.S. Geological Survey Earth Resources Observation and Science (EROS) Center. Work performed under contract 03CRCN0001.
3U.S. Geological Survey.
 Contents | Citation
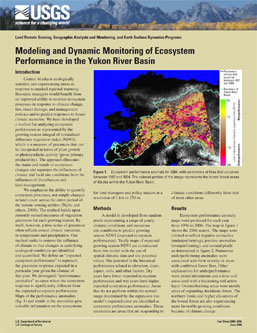
IntroductionCentral Alaska is ecologically sensitive and experiencing stress in response to marked regional warming. Resource managers would benefit from an improved ability to monitor ecosystem processes in response to climate change, fire, insect damage, and management policies and to predict responses to future climate scenarios. We have developed a method for analyzing ecosystem performance as represented by the growing season integral of normalized difference vegetation index (NDVI), which is a measure of greenness that can be interpreted in terms of plant growth or photosynthetic activity (gross primary productivity). The approach illustrates the status and trends of ecosystem changes and separates the influences of climate and local site conditions from the influences of disturbances and land management. We emphasize the ability to quantify ecosystem processes, not simply changes in land cover, across the entire period of the remote sensing archive (Wylie and others, 2008). The method builds upon remotely sensed measures of vegetation greenness for each growing season. By itself, however, a time series of greenness often reflects annual climate variations in temperature and precipitation. Our method seeks to remove the influence of climate so that changes in underlying ecological conditions are identified and quantified. We define an "expected ecosystem performance" to represent the greenness response expected in a particular year given the climate of that year. We distinguish "performance anomalies" as cases where the ecosystem response is significantly different from the expected ecosystem performance. Maps of the performance anomalies (fig. 1) and trends in the anomalies give valuable information on the ecosystems for land managers and policy makers at a resolution of 1 km to 250 m. |
Posted June 2008
Download report (857 KB pdf) |
Introduction
Methods
Results
Using Ecosystem Performance
References
Wylie, B.K., Zhang, L., Ji, L., Tieszen, L.L., and Bliss, N.B., 2008, Modeling and dynamic monitoring of ecosystem performance in the Yukon River Basin: U.S. Geological Survey Fact Sheet 2008-3016, 2 p.

![]() U.S. Department of the Interior | U.S. Geological Survey
U.S. Department of the Interior | U.S. Geological Survey
URL: http://pubsdata.usgs.gov/pubs/fs/2008/3016/index.html
Questions or Assistance: Contact USGS
Last modified: Tuesday, 29-Nov-2016 18:20:44 EST
