Fact Sheet 2009–3093
IntroductionCommercial pesticide applicators, farmers, and homeowners apply about 1 billion pounds of pesticides annually to agricultural land, non-crop land, and urban areas throughout the United States (Gilliom and others, 2006, p. 1). The U.S. Environmental Protection Agency (USEPA) defines a pesticide as any substance used to kill or control insects, weeds, plant diseases, and other pest organisms. Although there are important benefits from the proper use of pesticides, like crop protection and prevention of human disease outbreaks, there are also risks. One risk is the contamination of groundwater and surface-water resources. Data collected during 1992–2001 from 51 major hydrologic systems across the United States indicate that one or more pesticide or pesticide breakdown product was detected in more than 50 percent of 5,057 shallow (less than 20 feet below land surface) wells and in all of the 186 stream sites that were sampled in agricultural and urban areas (Gilliom and others, 2006, p. 2-4). 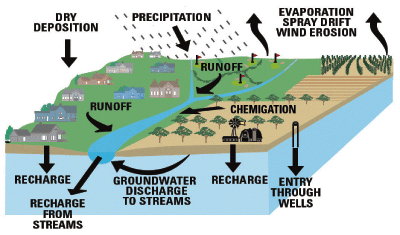 Figure 1. Schematic diagram illustrating routes of pesticides into streams and groundwater. (Modified from Gilliom and others, 2006.) Pesticides can contaminate surface water and groundwater from both point sources and non-point sources. Point sources are from specific locations such as spill sites, disposal sites, pesticide drift during application, and application of pesticides to control aquatic pests. Non-point sources represent the dominant source of surface water and groundwater contamination and may include agricultural and urban runoff, erosion, leaching from application sites, and precipitation that has become contaminated by upwind applications. Pesticides typically enter surface water when rainfall or irrigation exceeds the infiltration capacity of soil and resulting runoff then transports pesticides to streams, rivers, and other surface-water bodies. Contamination of groundwater may result directly from spills near poorly sealed well heads and from pesticide applications through improperly designed or malfunctioning irrigation systems that also are used to apply pesticides (chemigation; Carpenter and Johnson, 1997). Groundwater contamination also may come indirectly by the percolation of agricultural and urban irrigation water through soil layers and into groundwater and from pesticide residue in surface water, such as drainage ditches, streams, and municipal wastewater (fig. 1). 
To protect surface water and groundwater from pesticide contamination, the USEPA requires that all states establish a pesticide management plan. The Nevada Department of Agriculture (NDOA), with assistance from the USEPA, developed a management program of education (Hefner and Donaldson, 2006), regulation (Johnson and others, 2006), and monitoring (Pennington and others, 2001) to protect Nevada’s water resources from pesticide contaminants. Sampling sites are located in areas where urban or agricultural pesticide use may affect groundwater, water bodies, endangered species, and other aquatic life (fig. 2). Information gathered from these sites is used by NDOA to help make regulatory decisions that will protect human and environmental health by reducing and eliminating the occurrence of pesticide contamination. This fact sheet describes current (2008) pesticide monitoring of groundwater and streams by the NDOA in Nevada and supersedes Pennington and others (2001).  Figure 2. Areas of pesticide monitoring by Nevada Department of Agriculture. Table 1. Locations of Nevada Department of Agriculture pesticide-monitoring sites in Nevada, sampled semiannually, 1997–2008. [Hydrographic area: Formal hydrographic area name in Nevada (Rush, 1968; Cardinalli and others, 1968). Abbreviations: GW, groundwater; SW, surface water; NA, not applicable]
1Surface-water sites are planned for future pesticide monitoring. Monitoring for Pesticides
A network of pesticide sampling sites in urban and agricultural areas across the State is a critical element of the NDOA pesticide management plan and is essential to help detect contamination in its early stages. In 1993, the NDOA began monitoring deep groundwater by collecting samples from irrigation, domestic, and municipal wells. NDOA detected no pesticides in groundwater during this phase of the program. However, the U.S. Geological Survey (USGS) National Water-Quality Assessment (NAWQA) program reported the detection of pesticides (1993–95) in shallow groundwater 100 feet or less below land surface in the urban areas of Reno-Sparks and Las Vegas, and in the agricultural areas of Carson Valley and Carson Desert (Bevans and others, 1998; Lico, 1998). This information led NDOA and USGS, in a cooperative effort, to modify the design of the pesticide monitoring network and in 1997 the first shallow wells were installed and sampled. The groundwater monitoring network has continued to grow and by 2008 included 63 shallow wells. In 2007, NDOA began developing a network of surface-water monitoring sites (fig. 3). Site selection was based on land use and potential effects of pesticides on water quality, aquatic life, and endangered species. Six surface-water sites were sampled in 2008 (table 1, fig. 2). Objectives of sampling are to assess the occurrence of pesticides in shallow groundwater and surface water to provide decisionmakers with information needed to evaluate and manage pesticide application practices designed to protect drinking water resources, especially the deeper, potable groundwater as well as aquatic species. The surface-water monitoring network was sampled once in 2008 from 6 sites in urban areas in Mason Valley (1 site), Truckee Meadows (2 sites), and Virgin River Valley (3 sites; fig. 2; table 1). Plans are underway to expand the surface-water network (fig. 2) to other areas, including Smith (area 12) and Las Vegas (area 14) Valleys and Carson Desert (area 6). The current groundwater monitoring network includes 63 shallow wells installed in the upper 10 to 30 feet of the water table. Samples have been collected semiannually from agricultural, rangeland, and urban sites, which are located in 12 geographic areas throughout the state (fig. 2; table 1). NDOA analyzed each sample collected from both monitoring networks for 72 pesticides and pesticide degradation products. Pesticides included in these analyses that are most widely used in Nevada are listed in table 2. Table 2. Pesticide compounds (and selected degradation products) analyzed in water samples from the Nevada Department of Agriculture pesticide monitoring network and associated laboratory reporting limits, maximum contaminant levels, and health advisory levels. [Maximum contaminant level: Maximum concentration allowed in drinking water by U.S. Environmental Protection Agency (U.S. Environmental Protection Agency, 2006). Health advisory level reference dose: Daily oral intake, on a body weight basis estimated to be without adverse noncancer health risk by U.S. Environmental Protection Agency (U.S. Environmental Protection Agency, 2006). Abbreviations: µg/L, microgram per liter; (mg/kg)/d, milligram per kilogram per day. Symbols: –, no maximum contaminant level or health advisory level established]
1 Detected in at least one sample collected from a well in the Nevada Department of Agriculture pesticide monitoring network. 2 Detected in at least one surface-water sample collected from the Nevada Department of Agriculture pesticide monitoring network. 
To date (2008), 13 pesticides and pesticide breakdown products have been detected from the monitoring network (table 2). All concentrations of pesticides detected were less than the USEPA maximum contaminant level (MCL) with one exception. The herbicide atrazine was detected in one sample (3.6 micrograms per liter), which is slightly higher than the MCL for public drinking water (3 micrograms per liter). Atrazine and metolachlor are the two most heavily used herbicides in the Nation, primarily to control weeds in corn fields, but also to control weeds in nonagricultural areas (Gilliom and others, 2006, p. 54). Both pesticides were detected in at least one sample from a well in the Nevada pesticide network. A summary of the number of wells from the 12 geographic areas sampled since 1997 where pesticides were detected is listed in table 3. Three of the six surface water samples collected in 2008 had detectable concentrations of 2,4-D and diuron; two of the five frequently detected herbicides used for nonagricultural purposes, especially in urban areas (Gilliom and others, 2006, p. 10). Samples collected from shallow wells and surface water serve as part of an early warning system to help identify contamination sources and to aid in the development of effective programs and practices aimed at protecting Nevada’s water resources. This may include the use of alternative products or application restrictions for pesticides that cause contamination (Hefner and Donaldson, 2006). Table 3. Summary of pesticide detections in Nevada Department of Agriculture groundwater-monitoring network samples, 1997–2008.
References CitedBevans, H.E., Lico, M.S., and Lawrence, S.J., 1998, Water quality in the Las Vegas Valley area and the Carson and Truckee River Basins, Nevada-California, 1992–96: U.S. Geological Survey Circular 1170, 47 p. Cardinalli, J.L., Roach, L.M., Rush, F.E., and Vasey, B.J., 1968, State of Nevada hydrographic areas: Nevada Division of Water Resources map, scale 1:500,000. Carpenter, Jon, and Johnson, W.S., 1997, Pesticide chemigation through pumped irrigation systems—Anti-pollution devices and management practices to prevent groundwater contamination: University of Nevada, Reno, Fact Sheet FS-97-37, 4 p., accessed November 13, 2008, at http://www.unce.unr.edu/publications/files/ag/other/fs9737.pdf Gilliom, R.J., Barbash, J.E., Crawford, C.G., Hamilton, P.A., Martin, J.D., Nakagaki, Naomi, Nowell, L.H., Scott, J.C., Stackelberg, P.E., Thelin, G.P., and Wolock, D.M., 2006, The quality of our Nation’s waters—Pesticides in the Nation’s streams and ground water, 1992–2001: U.S. Geological Survey Circular 1291, 172 p. Hefner, Melody, and Donaldson, Susan, 2006, What to do about fertilizers and pesticides: Reno, University of Nevada, Nonpoint Education for Municipal Officials, Protecting our Water Action Guide #3: Fact Sheet-06-44, 2 p., accessed November 13, 2008, at http://www.unce.unr.edu/publications/files/ho/2006/fs0644.pdf Johnson, W.S., Moses, Charles, Cichowlaz, Schott, and Strom, Sue, 2006, The Nevada pesticide safety education program: Reno, University of Nevada, Cooperative Extension: Fact Sheet-06-65, 4 p., accessed November 13, 2008, at http://www.unce.unr.edu/publications/files/ho/2006/fs0665.pdf Lico, M.S., 1998, Quality of ground water beneath urban and agricultural lands in Las Vegas Valley, and the Carson and Truckee River Basins, Nevada-implications for water supply: U.S. Geological Survey Water-Resources Investigations Report 97-4259, 24 p. Pennington, Nyle, Adams, P.A., Moses, C.W., Bevans, H.E., Carpenter, Jon, and Cichowlaz, Schott, 2001, Monitoring for pesticides in ground water in Nevada, 2001: U.S. Geological Survey Fact Sheet FS-094-01, 2 p. Rush, F.E., 1968, Index of hydrographic areas in Nevada: Nevada Division of Water Resources, Information Report 56, 38 p. U.S. Environmental Protection Agency, 2006, Drinking water standards and health advisories: U.S. Environmental Protection Agency, EPA 822-R-06-013, 12 p., accessed November 13, 2008 at http://www.epa.gov/waterscience/criteria/drinking/dwstandards.pdf |
For additional information contact: Jon Carpenter Part or all of this report is presented in Portable Document Format (PDF); the latest version of Adobe Reader or similar software is required to view it. Download the latest version of Adobe Reader, free of charge. |
||||||||||||||||||||||||||||||||||||||||||||||||||||||||||||||||||||||||||||||||||||||||||||||||||||||||||||||||||||||||||||||||||||||||||||||||||||||||||||||||||||||||||||||||||||||||||||||||||||||||||||||||||||||||||||||||||||||||||||||||||||||||||||||||||||||||||||||||||||||||||||||||||||||||||||||||||||||||||||||||||||||||||||||||||||||||||||||||||||||||||||||||||||||||||||||||||||||||||||||||||||
Thodal, C.E., 2009, Monitoring for pesticides in groundwater and surface water in Nevada, 2008: U.S. Geological Survey Fact Sheet 2009-3093, 4 p.

![]() U.S. Department of the Interior |
U.S. Geological Survey
U.S. Department of the Interior |
U.S. Geological Survey
URL: http://
pubsdata.usgs.gov
/pubs/fs/2009/3093/index.html
Page Contact Information: GS Pubs Web Contact
Page Last Modified: Tuesday, 29-Nov-2016 17:35:31 EST
