Fact Sheet 2010–3057
IntroductionSince 1950, the U.S. Geological Survey Washington Water Science Center (USGS-WAWSC) has collected, compiled, and published, at 5-year intervals, statewide estimates of the amounts of water withdrawn and used for various purposes in Washington State. As new data and methods became available, some of the original datasets were recompiled. The most recent versions of these datasets were used in this fact sheet. The datasets are available online along with other USGS-WAWSC water-use publications at the USGS-WAWSC water use web page: http://wa.water.usgs.gov/data/wuse/. Values on these datasets and in this fact sheet may not sum to the indicated total due to independent rounding. Due to variations in data requirements, collection methods, terminology, and data sources, the direct assessment of water-use trends between compilations is difficult. This fact sheet focuses on the trends in total State and public-supplied populations, freshwater withdrawals and use, public-supply withdrawals and deliveries, and crop irrigation withdrawals and acreage in Washington from 1985 through 2005. These four categories were included in all five compilations and were the most stable in terms of data requirements, collection methods, terminology, and data sources. 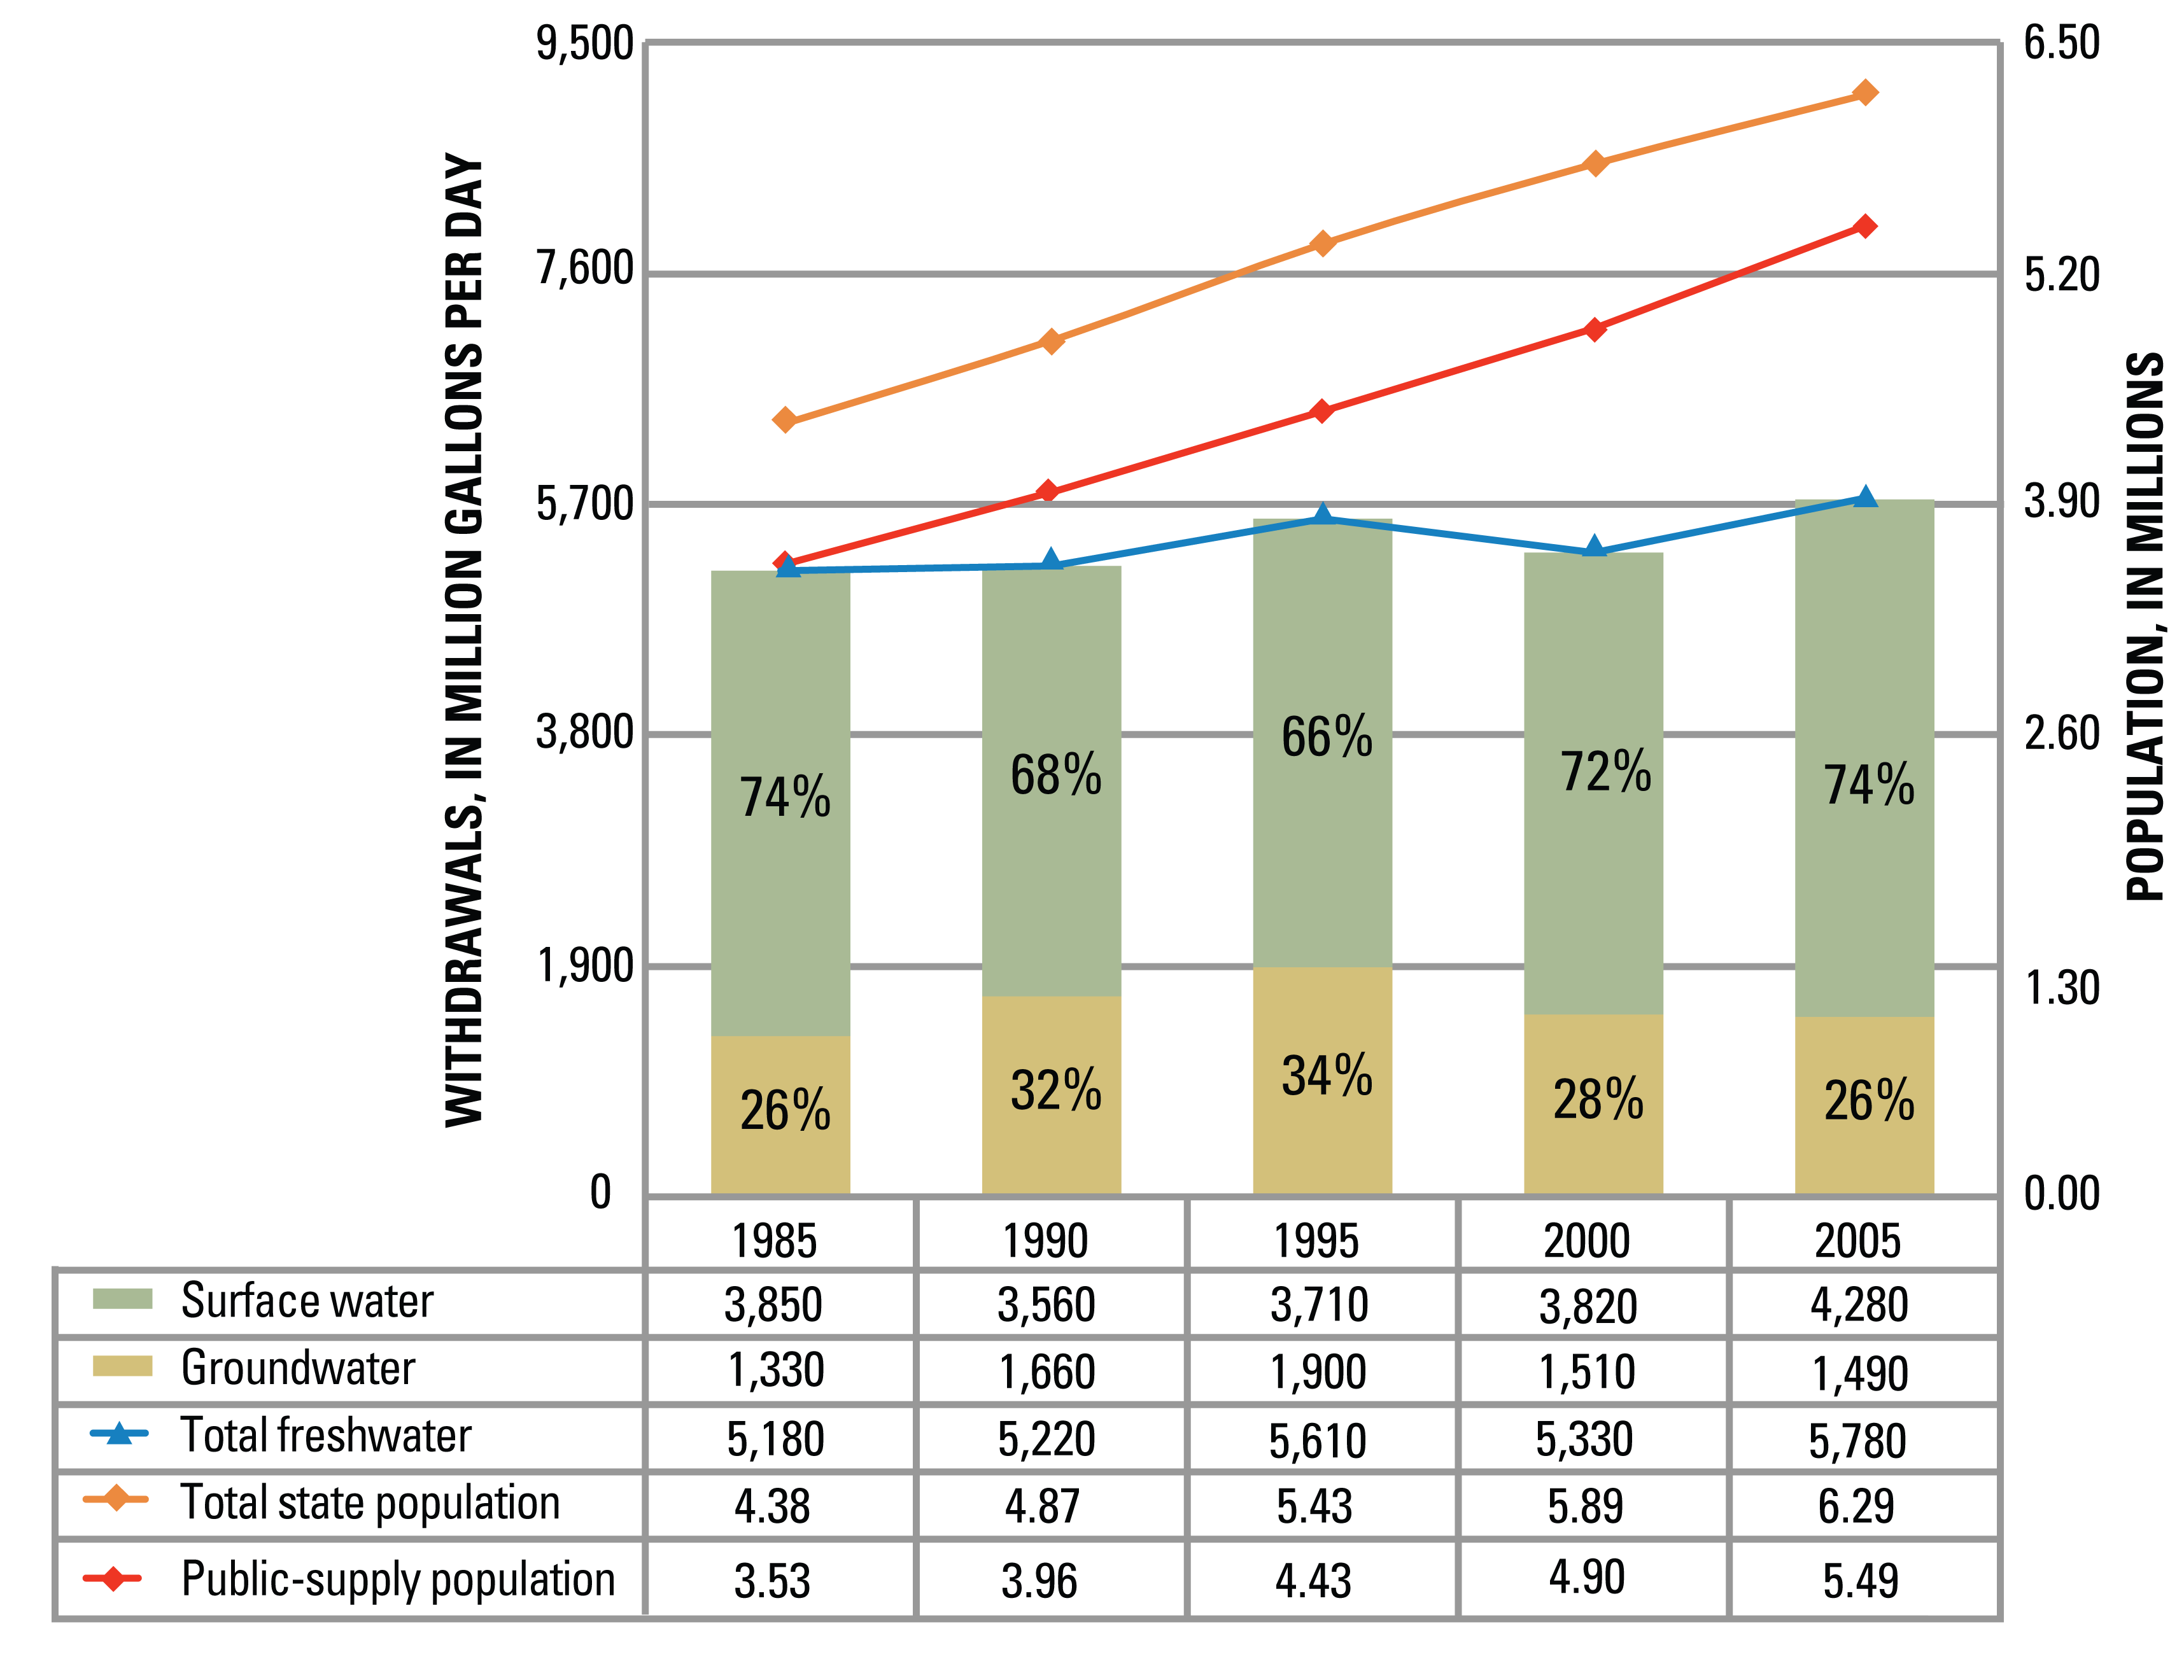 Figure 1. Populations and freshwater withdrawals. PopulationBetween 1985 and 2005, the total population in Washington State increased 44 percent from 4.38 to 6.29 million people (fig. 1). During the same period, the population served by class A public-supply systems increased 56 percent from 3.53 to 5.49 million people. The percentage of total population served by class A public-supply systems increased from 81 percent in 1985 to 87 percent in 2005. Freshwater WithdrawalsTotal freshwater withdrawals in Washington for 1985 were estimated to be 5,180 million gallons per day (Mgal/d) with surface water accounting for 74 percent (3,850 Mgal/d) and groundwater accounting for 26 percent (1,330 Mgal/d) of the total (fig. 1). By 2005, freshwater withdrawals had increased 12 percent to 5,780 Mgal/d, with surface water still accounting for 74 percent (4,280 Mgal/d) and groundwater accounting for 26 percent (1,490 Mgal/d) of the total. Additionally, between 1985 and 2005: Freshwater UseBetween 1985 and 2005, Public Supply accounted for 20 percent of freshwater withdrawals (fig. 2), 15 percent of surface-water withdrawals, and 32 percent of groundwater withdrawals in Washington. Crop Irrigation accounted for 58 percent of freshwater withdrawals, 62 percent of surfacewater withdrawals, and 49 percent of groundwater withdrawals. Together, these two categories accounted for 78 percent of freshwater withdrawals, 77 percent of surface-water withdrawals, and 81 percent of groundwater withdrawals. 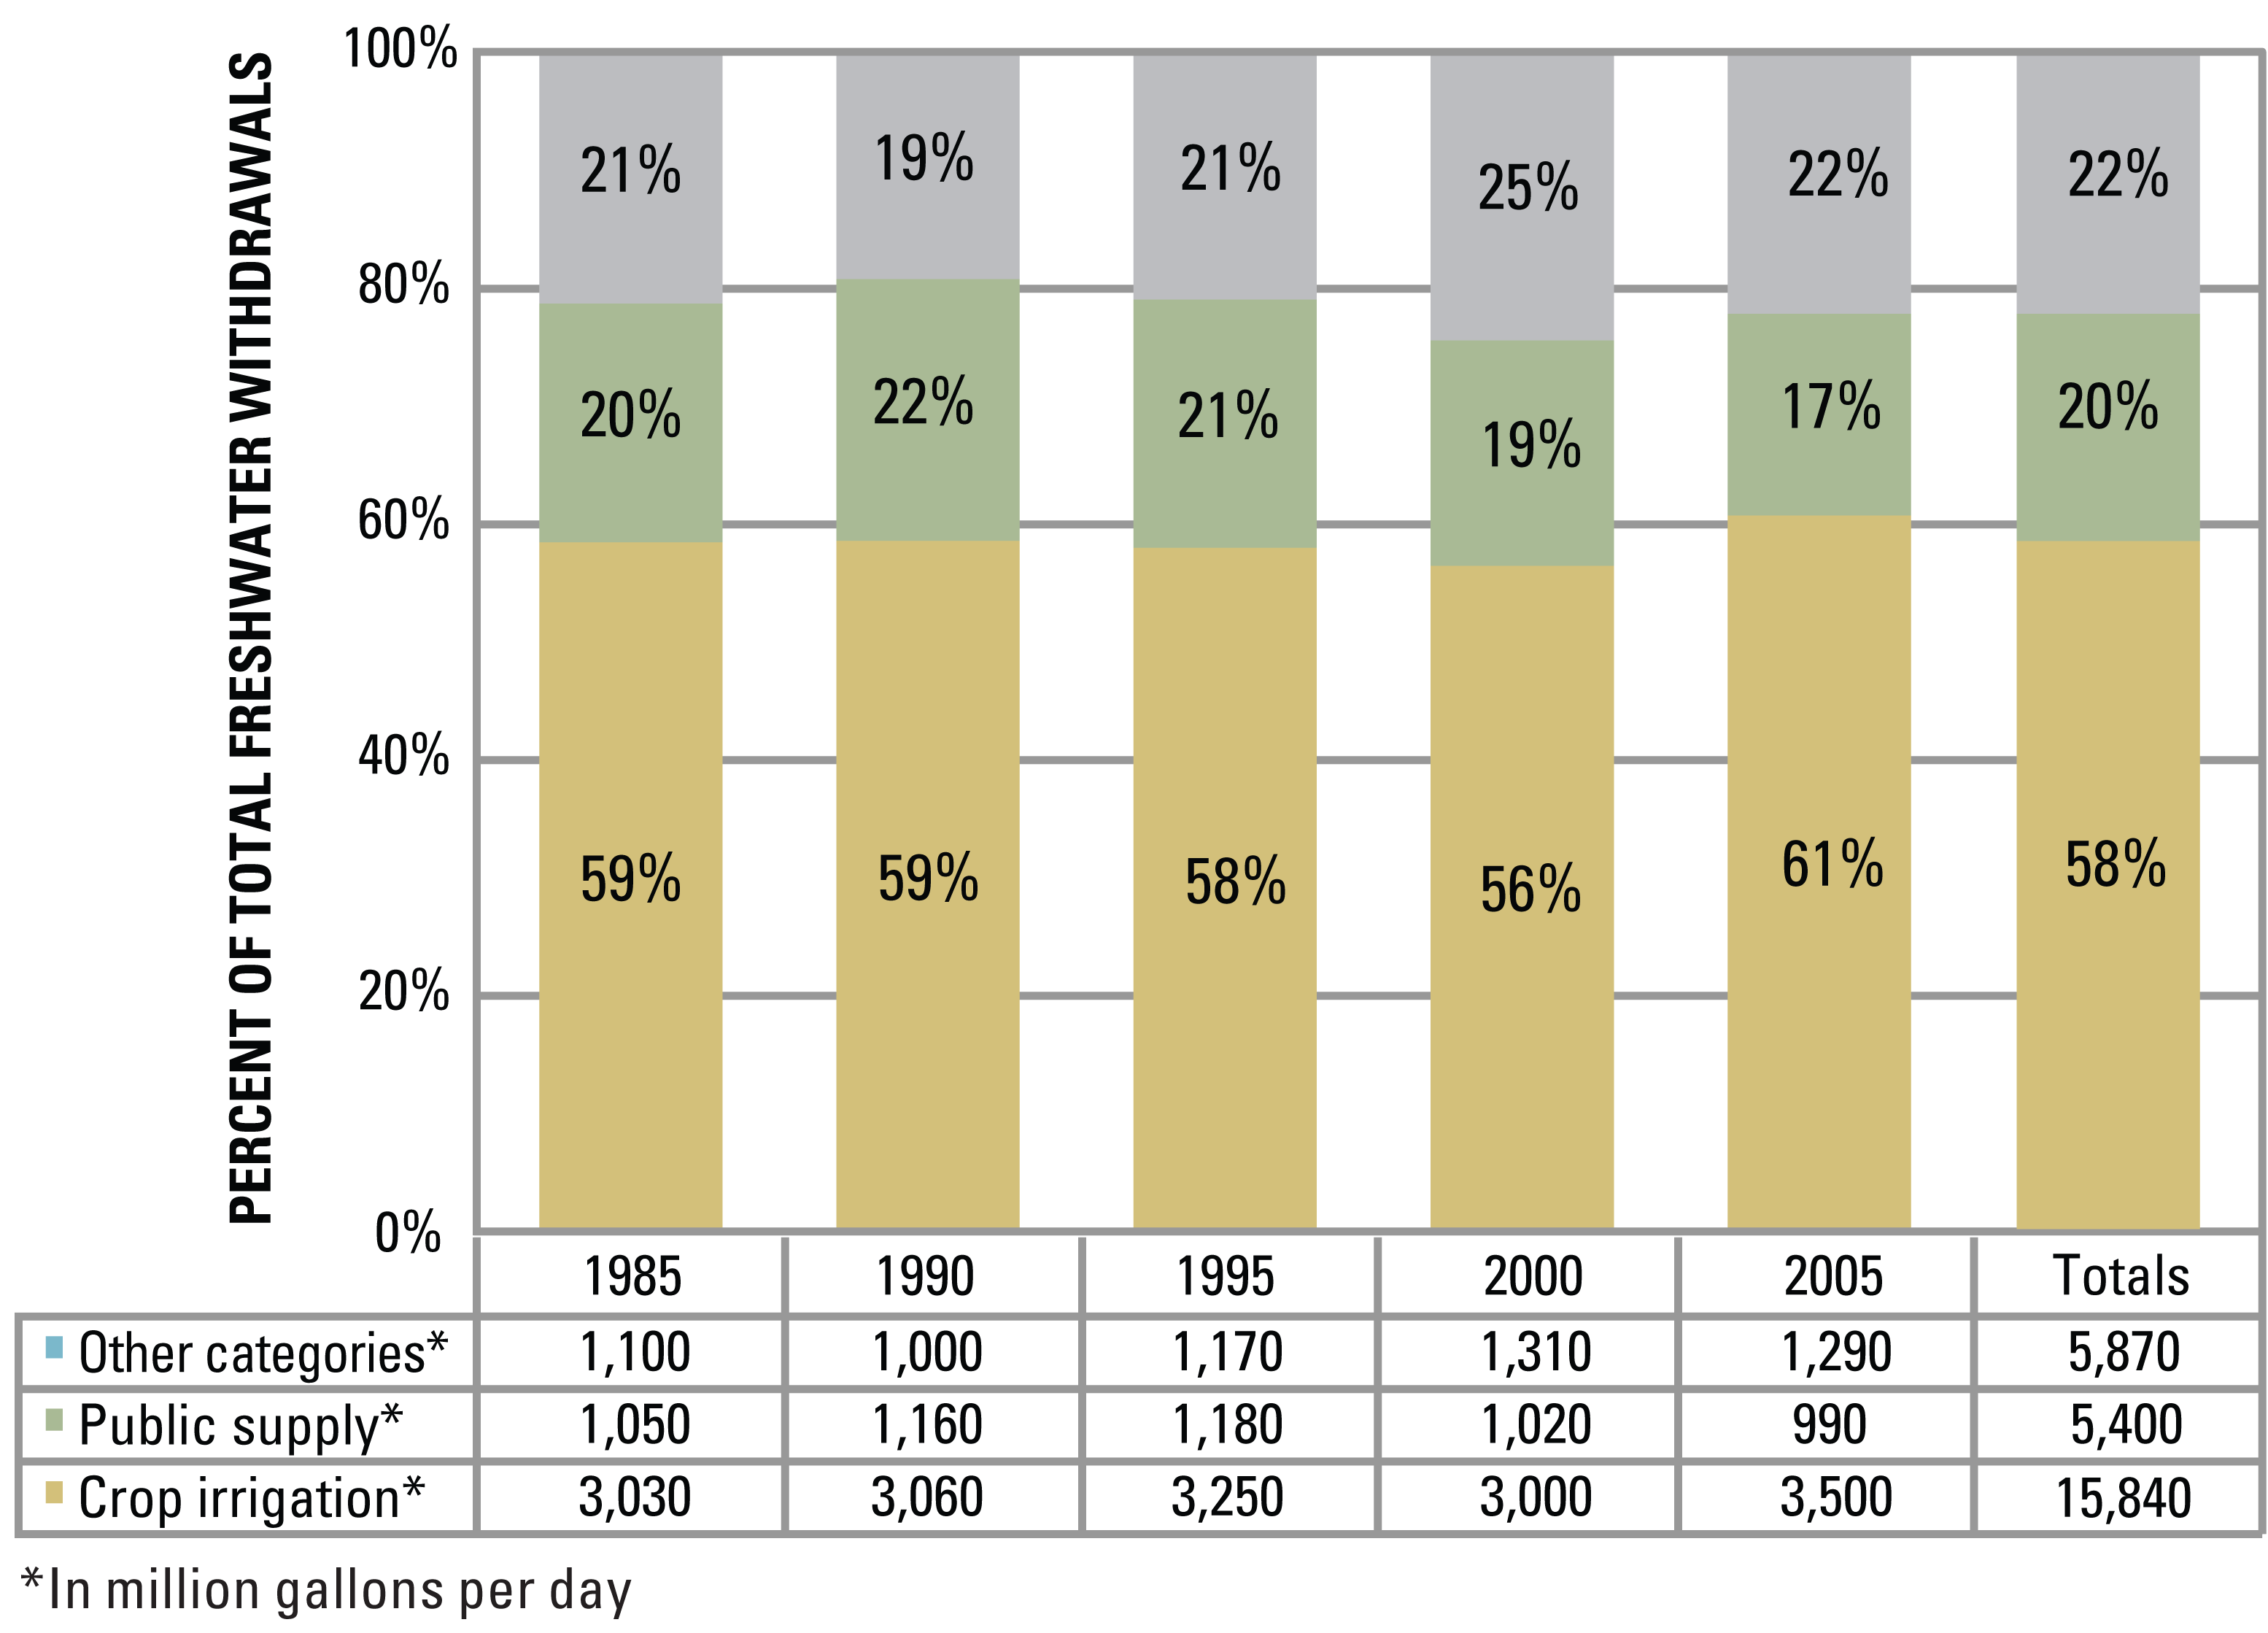 Figure 2. Freshwater by use. 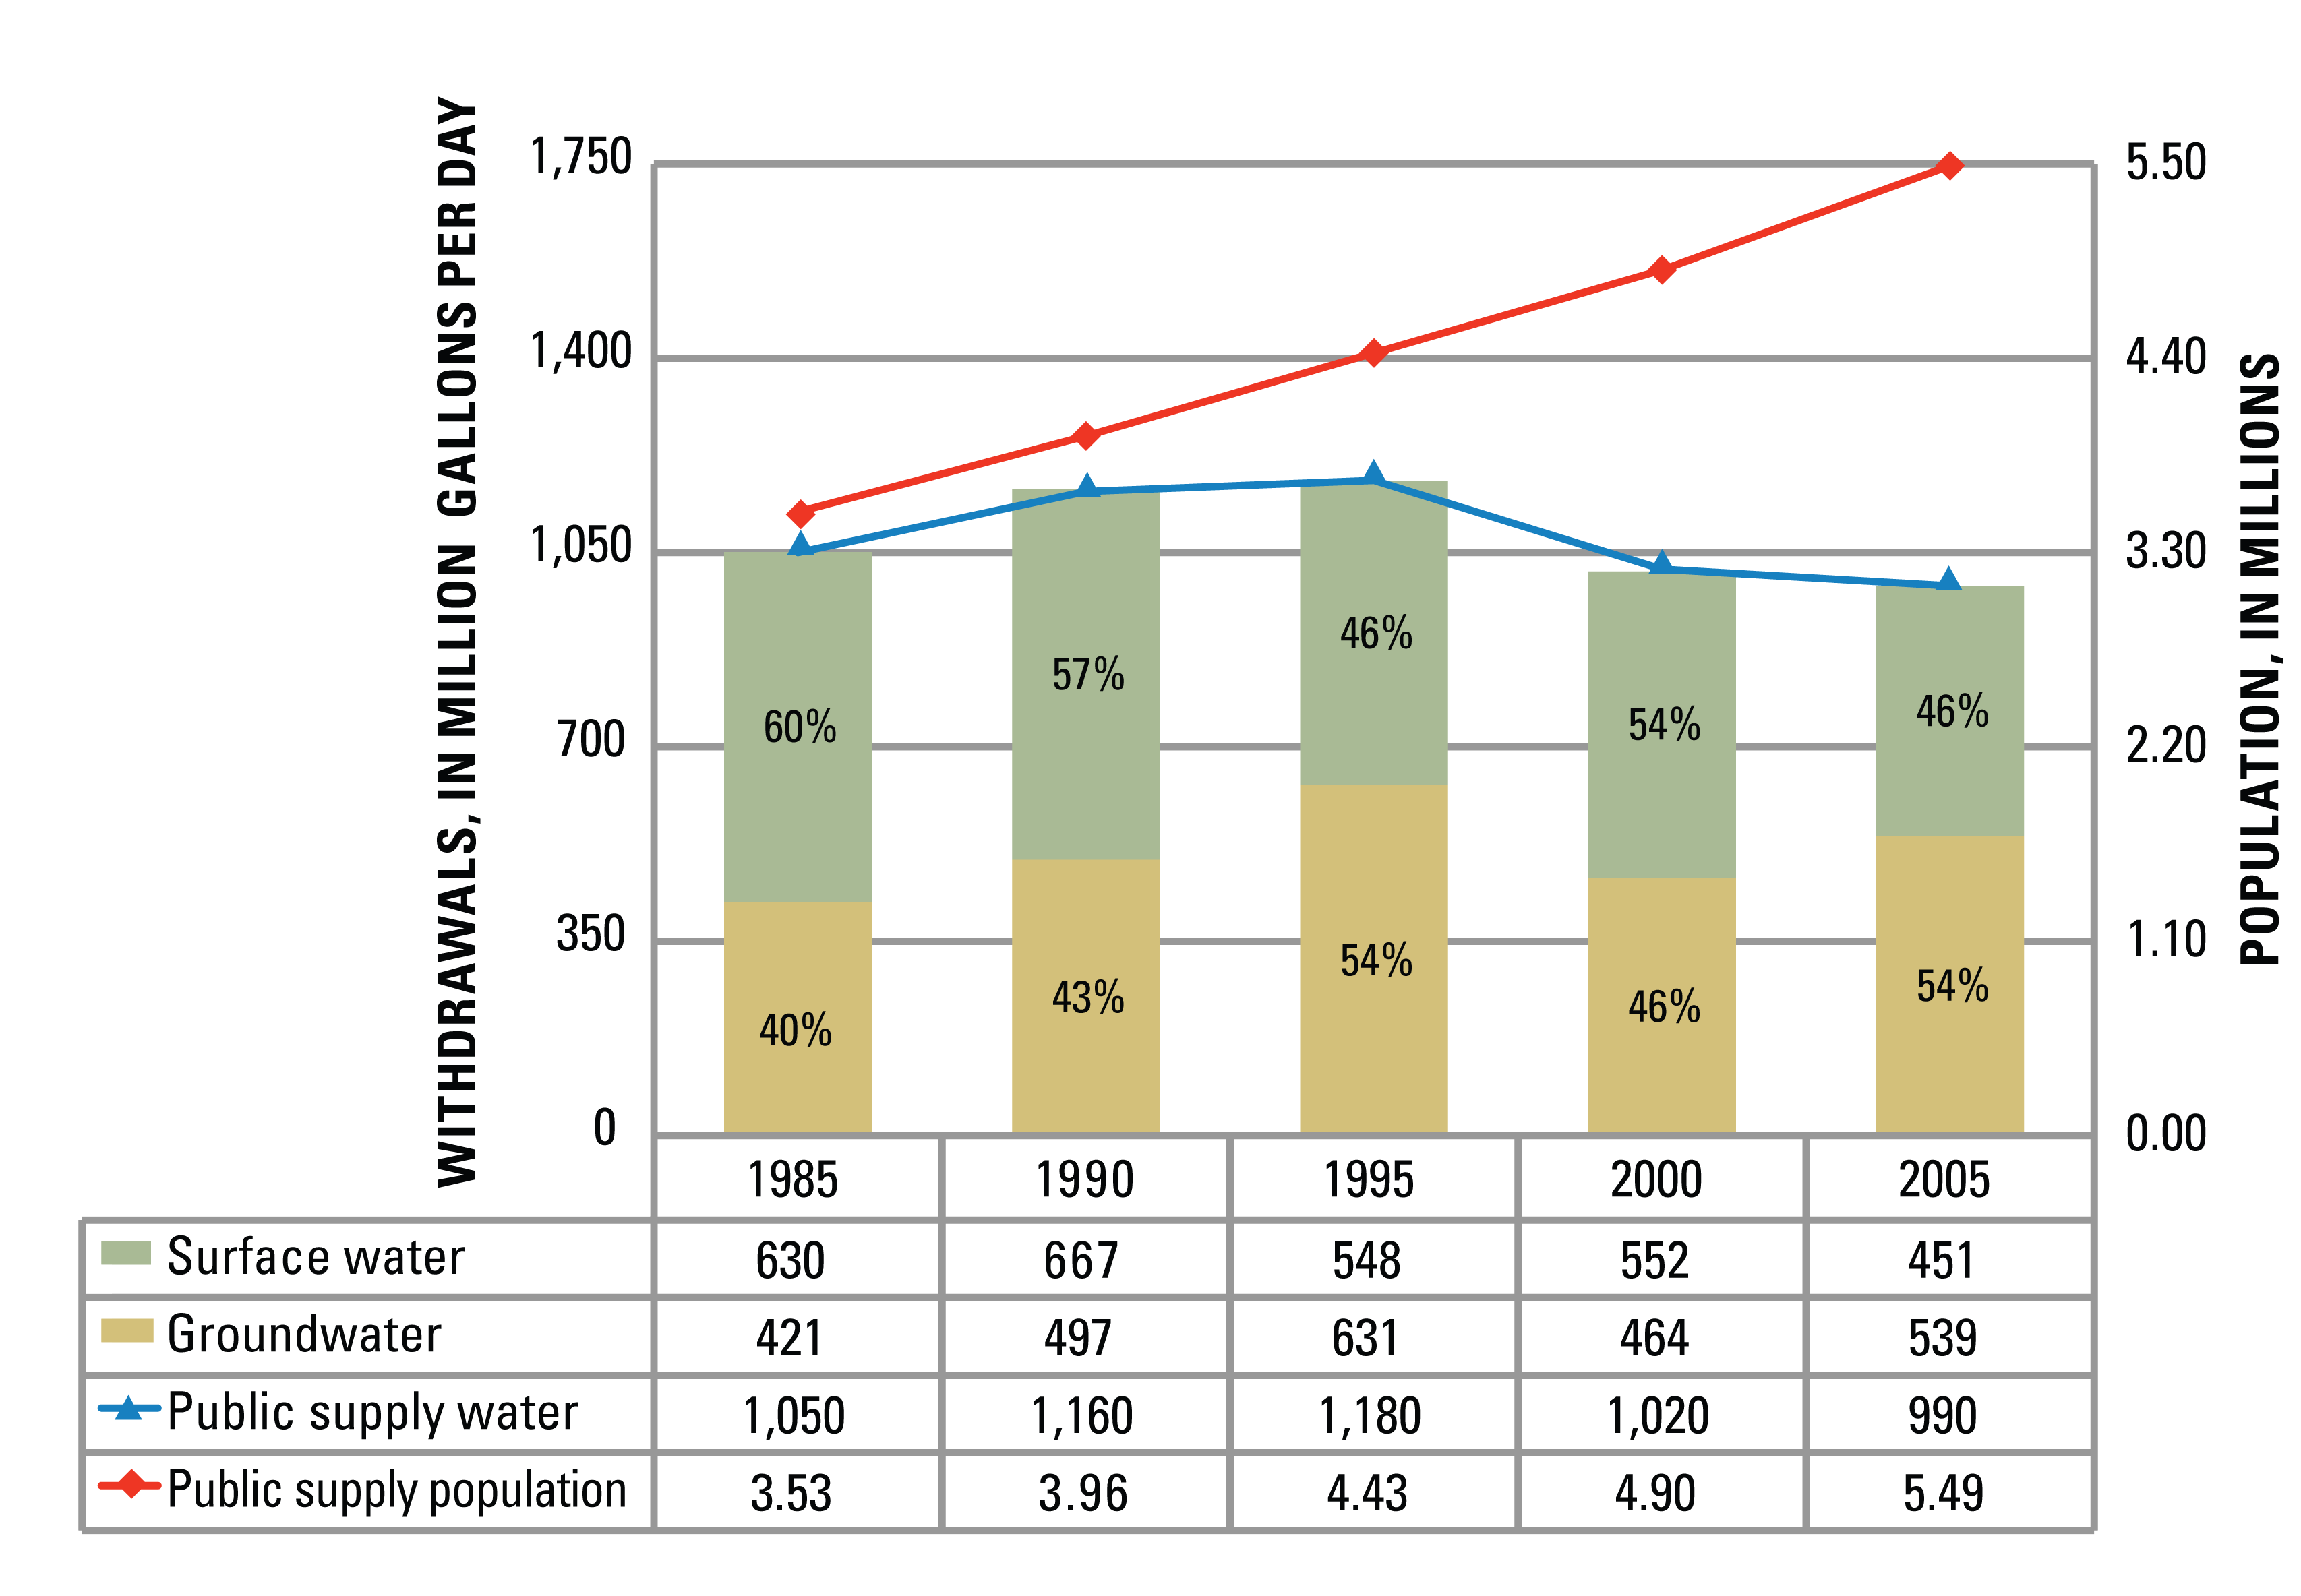 Figure 3. Public-supply withdrawals. Public-Supply Withdrawals Public-supply withdrawals in Washington for 1985 were estimated to be 1,050 Mgal/d, with surface water accounting for 60 percent (630 Mgal/d) and groundwater accounting for 40 percent (421 Mgal/d) of the total (fig. 3). By 1995, public‑supply withdrawals had increased 12 percent to 1,180 Mgal/d, with surface water accounting for 46 percent (548 Mgal/d) and groundwater for 54 percent (631 Mgal/d) of the total. Between 1995 and 2005, public-supply withdrawals decreased 16 percent from 1,180 to 990 Mgal/d (fig. 3). Surface-water withdrawals decreased 18 percent from 548 Mgal/d (54 percent of the total withdrawals) to 451 Mgal/d (46 percent of the total withdrawals). Groundwater withdrawals decreased 15 percent from 631 Mgal/d (54 percent of the total withdrawals) to 539 Mgal/d (also 54 percent of the total withdrawals). Public-Supply DeliveriesPublic-supply deliveries for domestic purposes in Washington for 1985 were estimated to be 516 Mgal/d or 49 percent of the total deliveries (fig. 4). By 1990, domestic deliveries had increased 17 percent to 604 Mgal/d or 52 percent of the total deliveries. Between 1990 and 2005, domestic deliveries decreased 7 percent from 604 Mgal/d (52 percent of total deliveries) to 562 Mgal/d (57 percent of total deliveries). Between 1985 and 1990, the per capita rate for public supplied domestic use increased 5 percent from 146 to 153 gallons per day (gal/d) and then decreased 33 percent to 102 gal/d in 2005. Public-supply deliveries for non-domestic use in 1985 were estimated to be 535 Mgal/d or 51 percent of the total deliveries (fig. 4). By 1995, non-domestic deliveries had increased 15 percent to 614 Mgal/d or 52 percent of the total deliveries. Between 1995 and 2000, non‑domestic deliveries decreased 24 percent to 467 Mgal/d or 46 percent of the total deliveries, and then decreased another 8 percent to 428 Mgal/d in 2005. 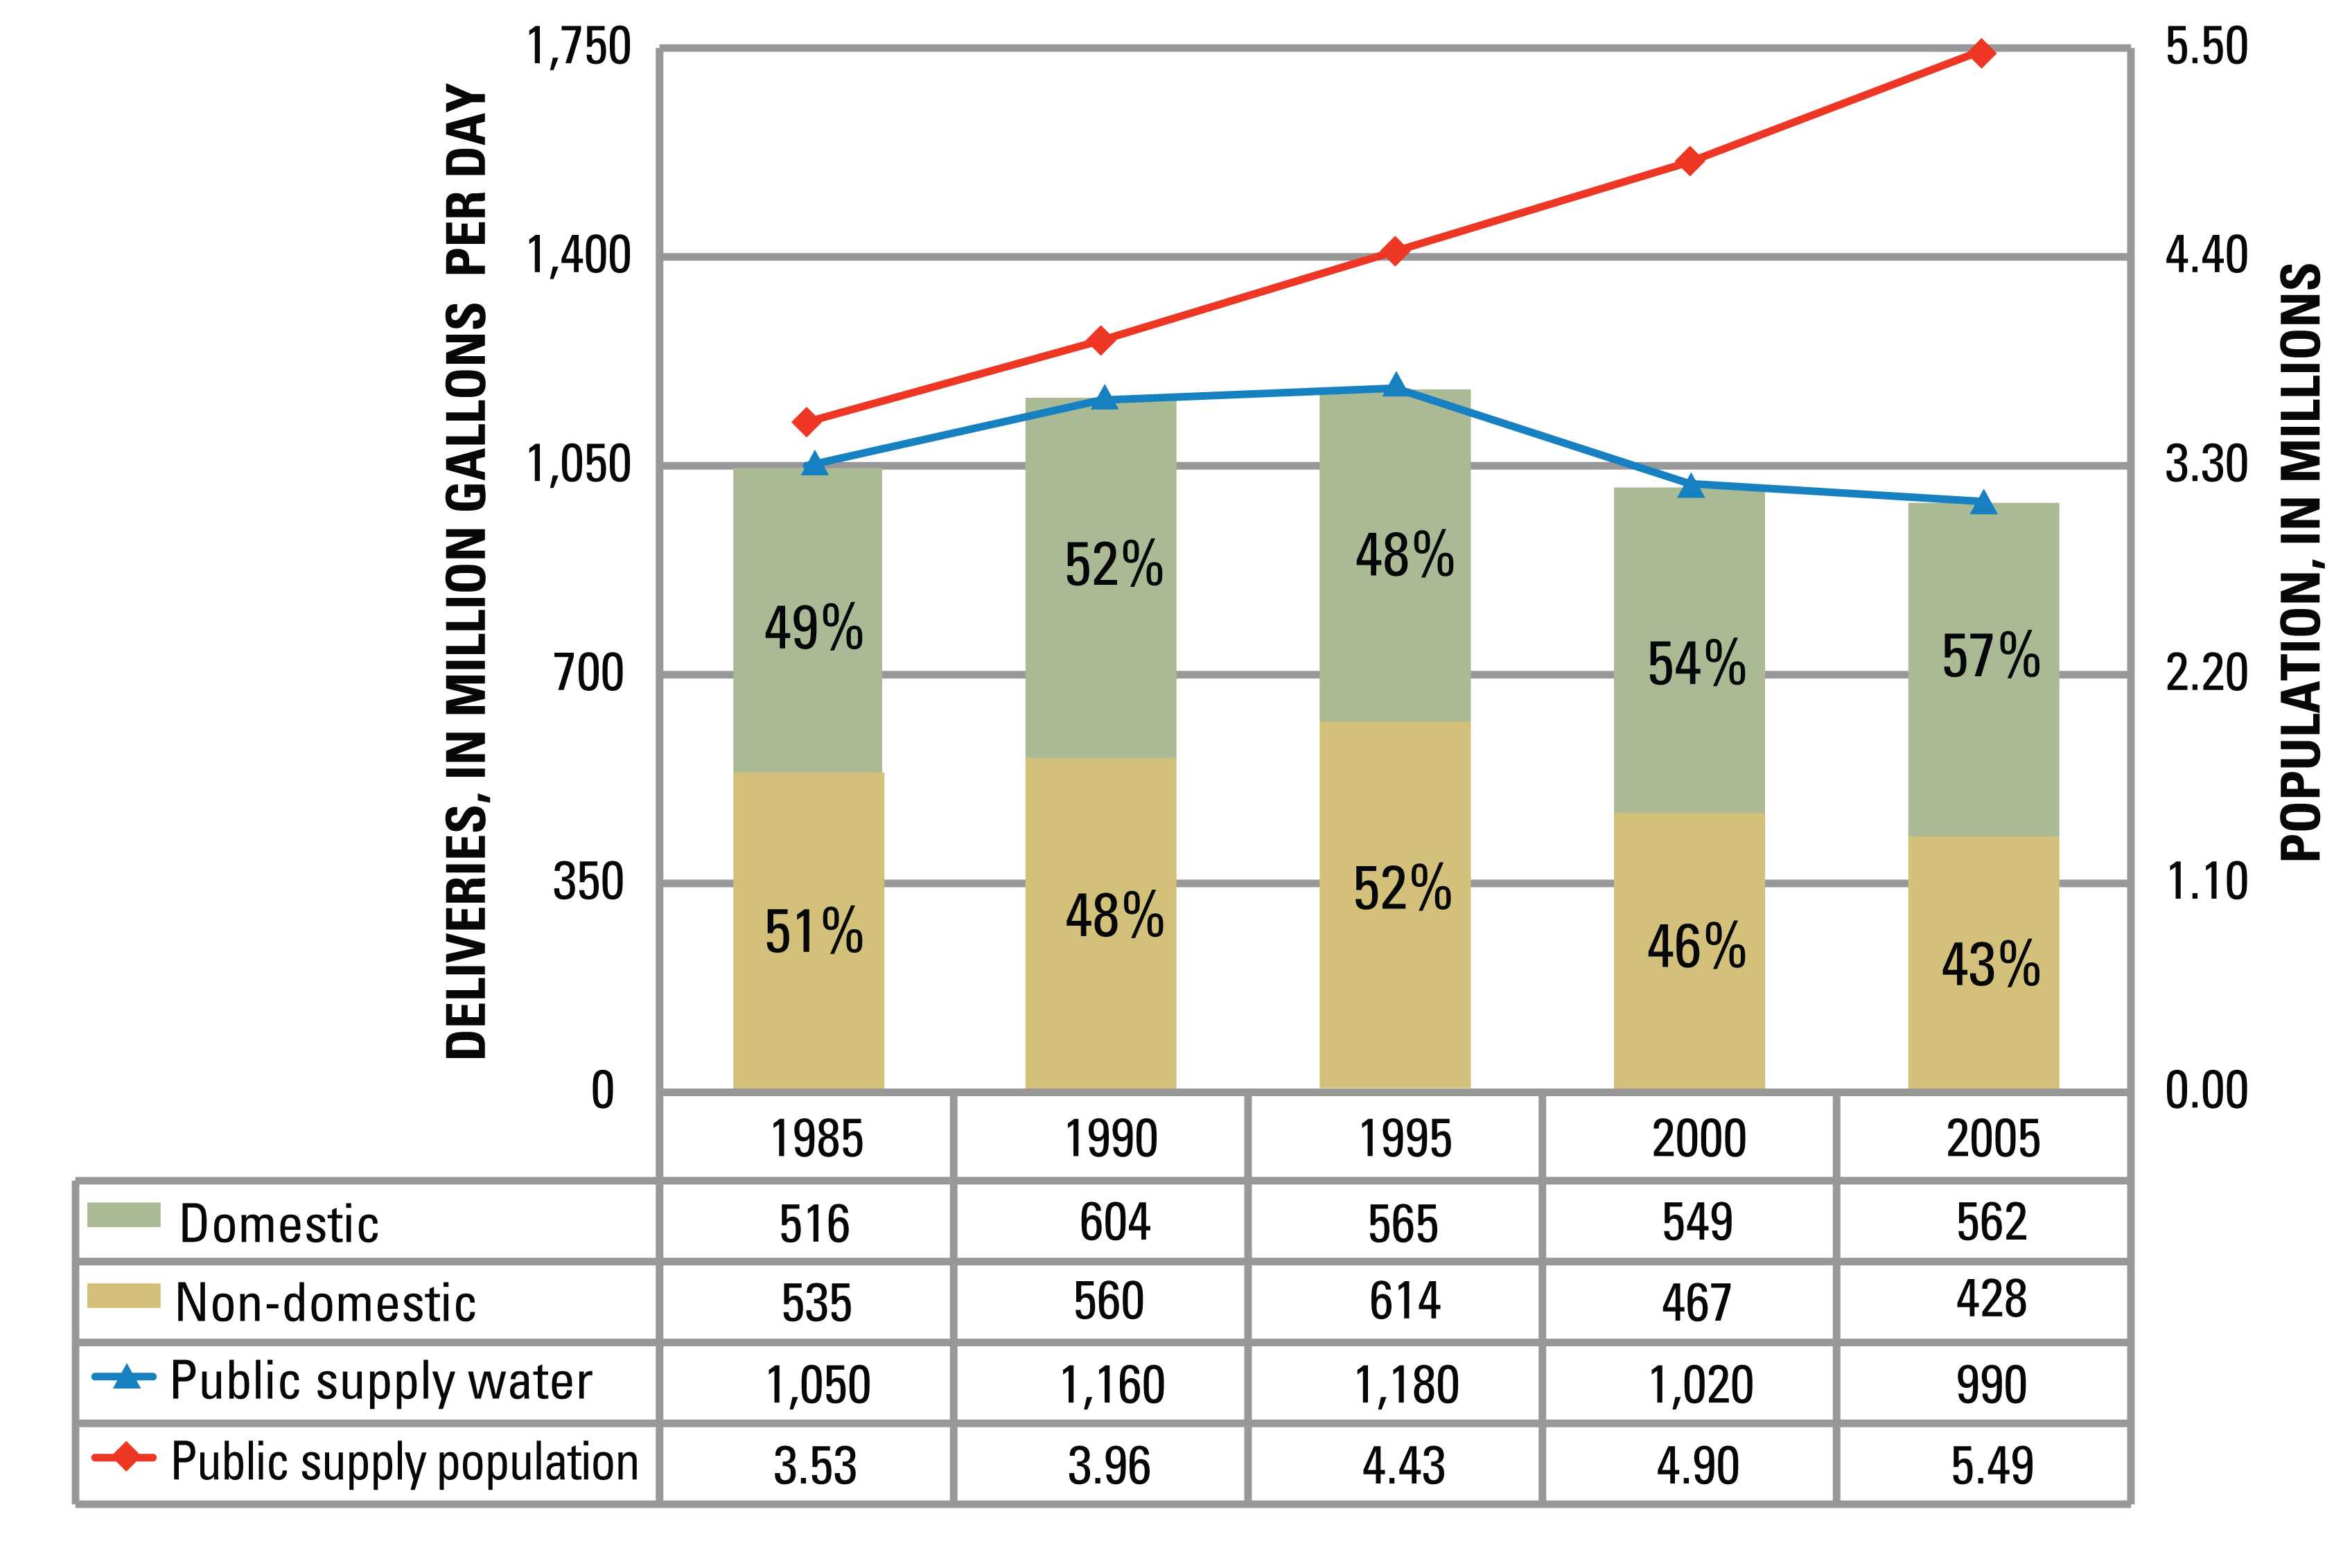 Figure 4. Public-supply deliveries. Crop-Irrigation WithdrawalsCrop-irrigation withdrawals in Washington increased 16 percent from 3,030 Mgal/d in 1985 to 3,500 Mgal/d in 2005 (figs. 5 and 6). Surface-water withdrawals for crop irrigation increased 22 percent from 2,370 Mgal/d in 1985 to 2,890 Mgal/d in 2005. Groundwater withdrawals for crop irrigation increased 46 percent from 657 Mgal/d in 1985 to 960 Mgal/d in 1995, and then decreased 36 percent to 613 Mgal/d in 2005. 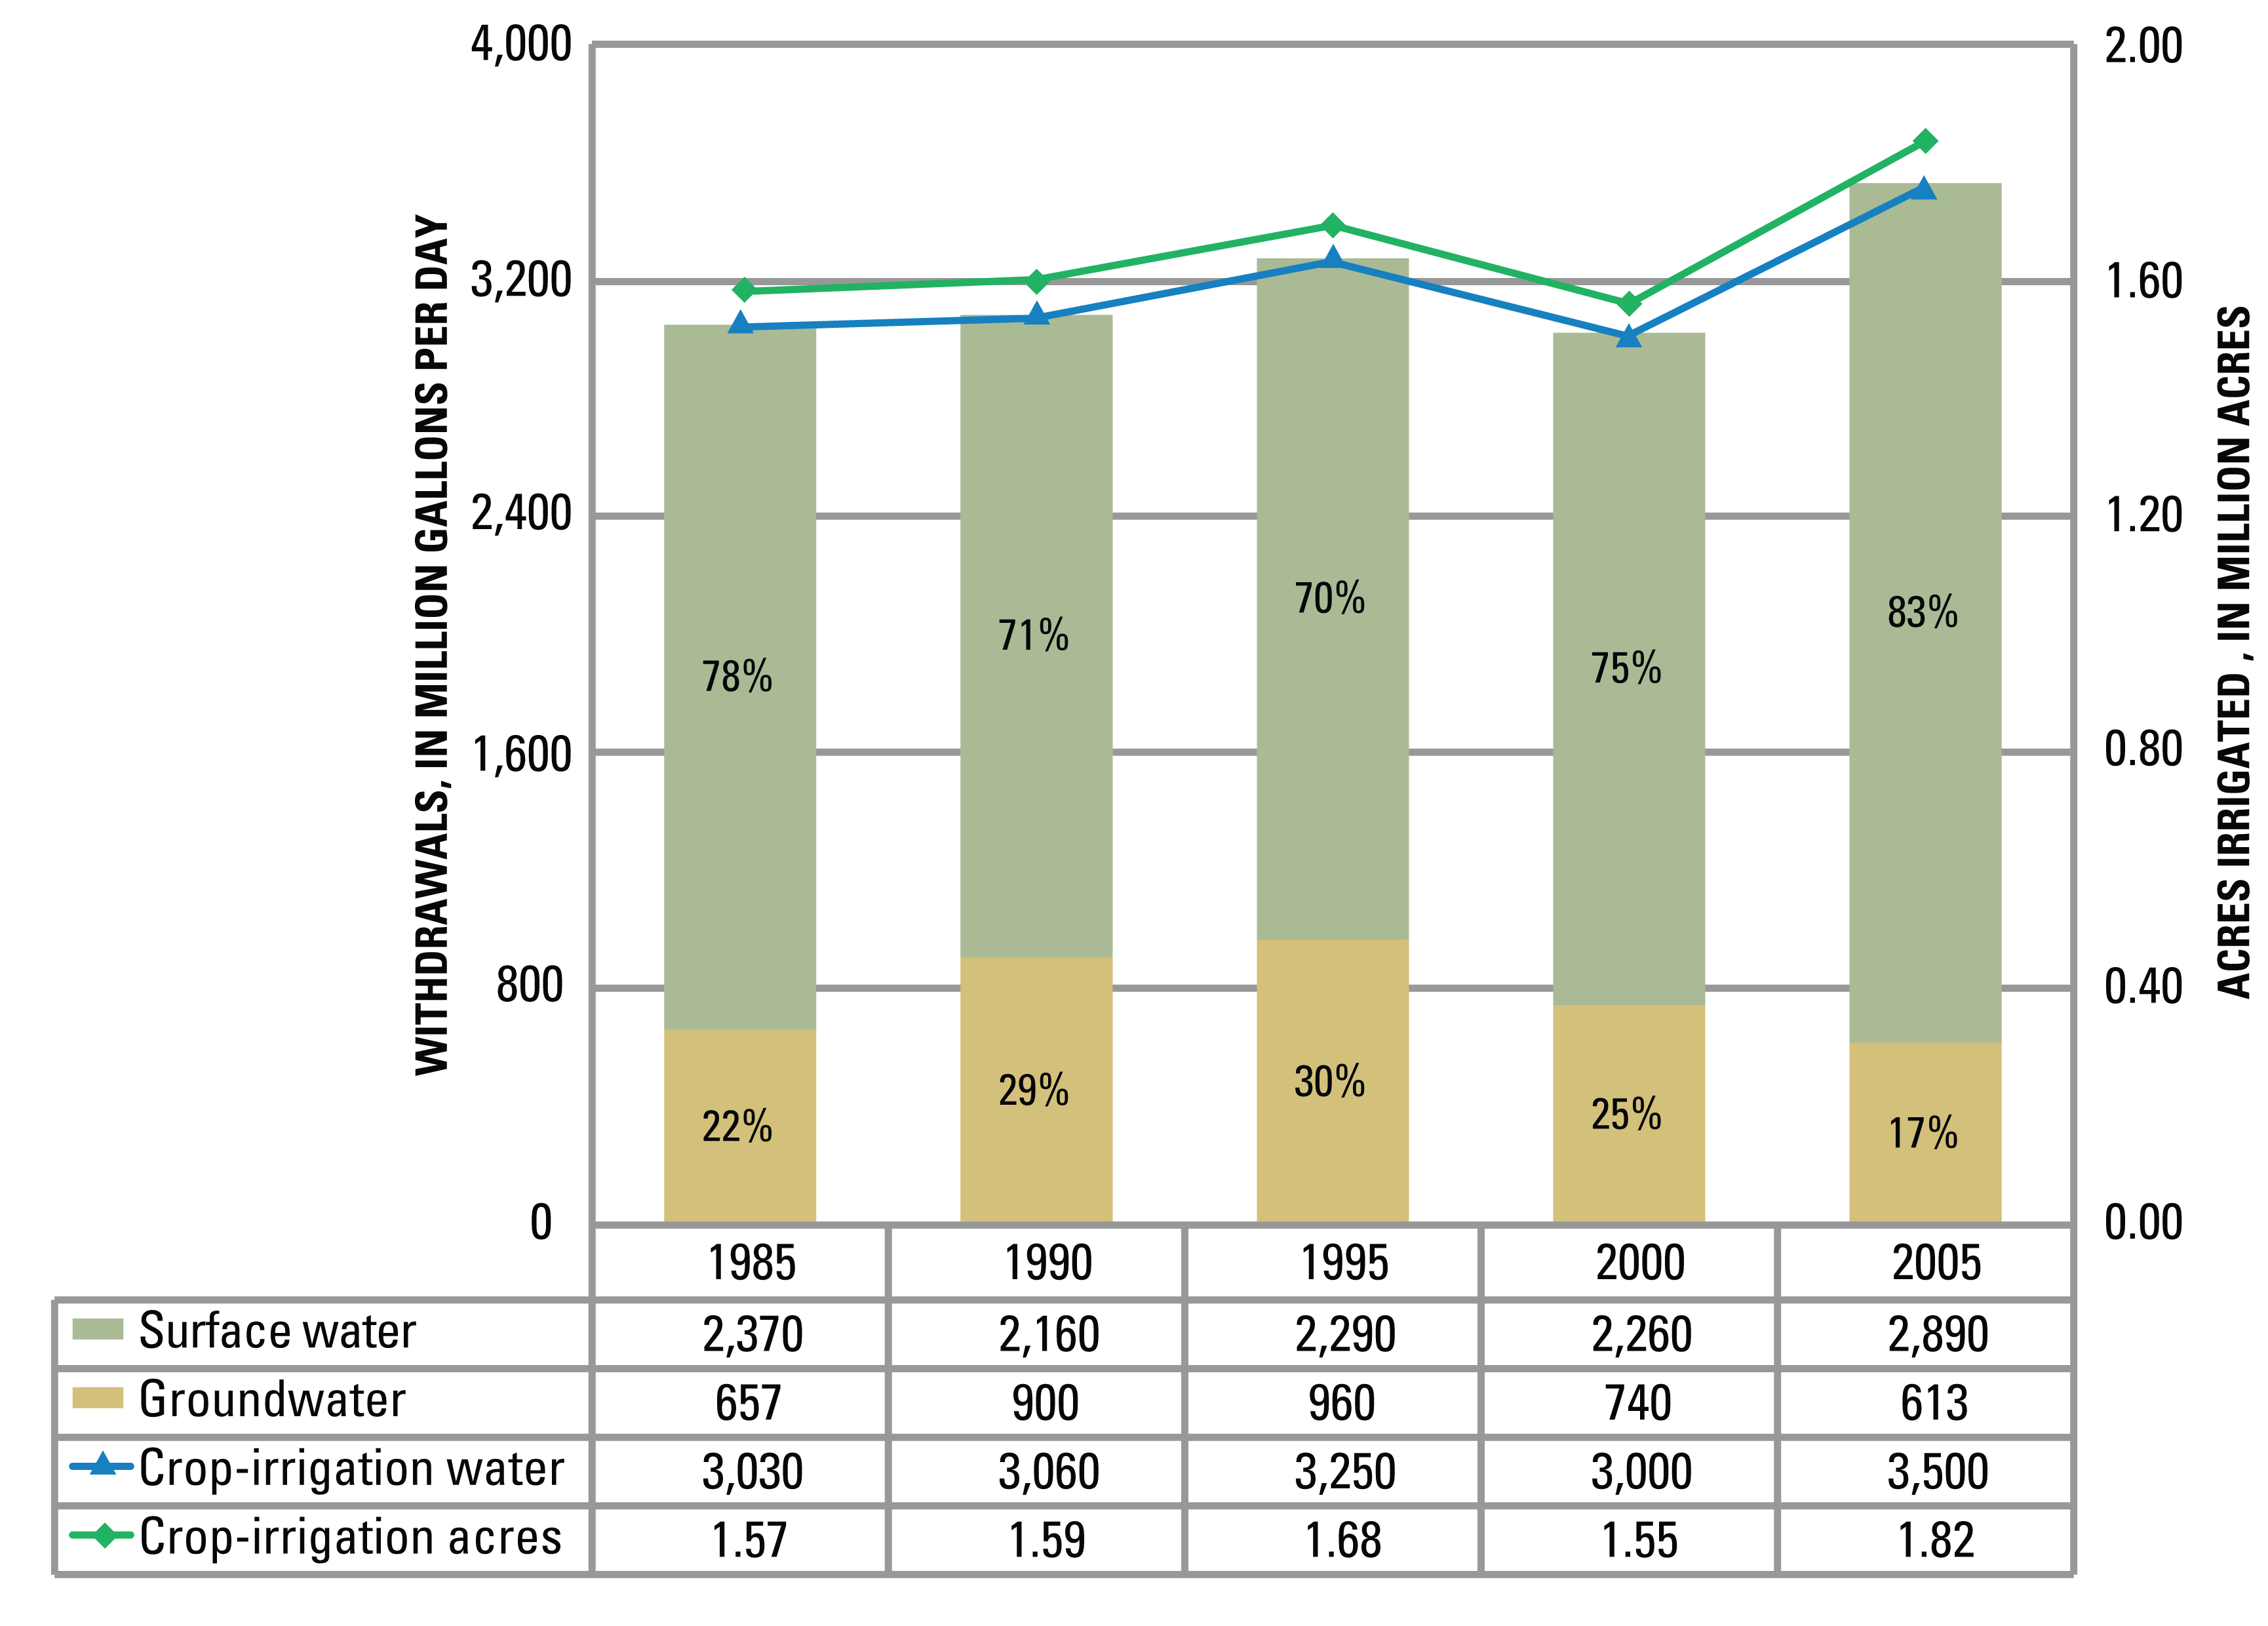 Figure 5. Crop-irrigation withdrawals. Crop Irrigation and Application Methods Crop-irrigation acreage in Washington increased 16 percent from 1.57 million acres in 1985 to 1.82 million acres in 2005 (figs. 5 and 6). The acreage irrigated by sprinkler methods increased 18 percent from 1.23 million acres in 1985 to 1.45 million acres in 2005. The acreage irrigated by surface methods decreased 21 percent from 0.34 million acres in 1985 to 0.27 million acres in 2005. The acreage irrigated by trickle, drip, or other microirrigation methods increased more than 330 percent from 0.03 million acres in 1990 to 0.10 million acres in 2005. 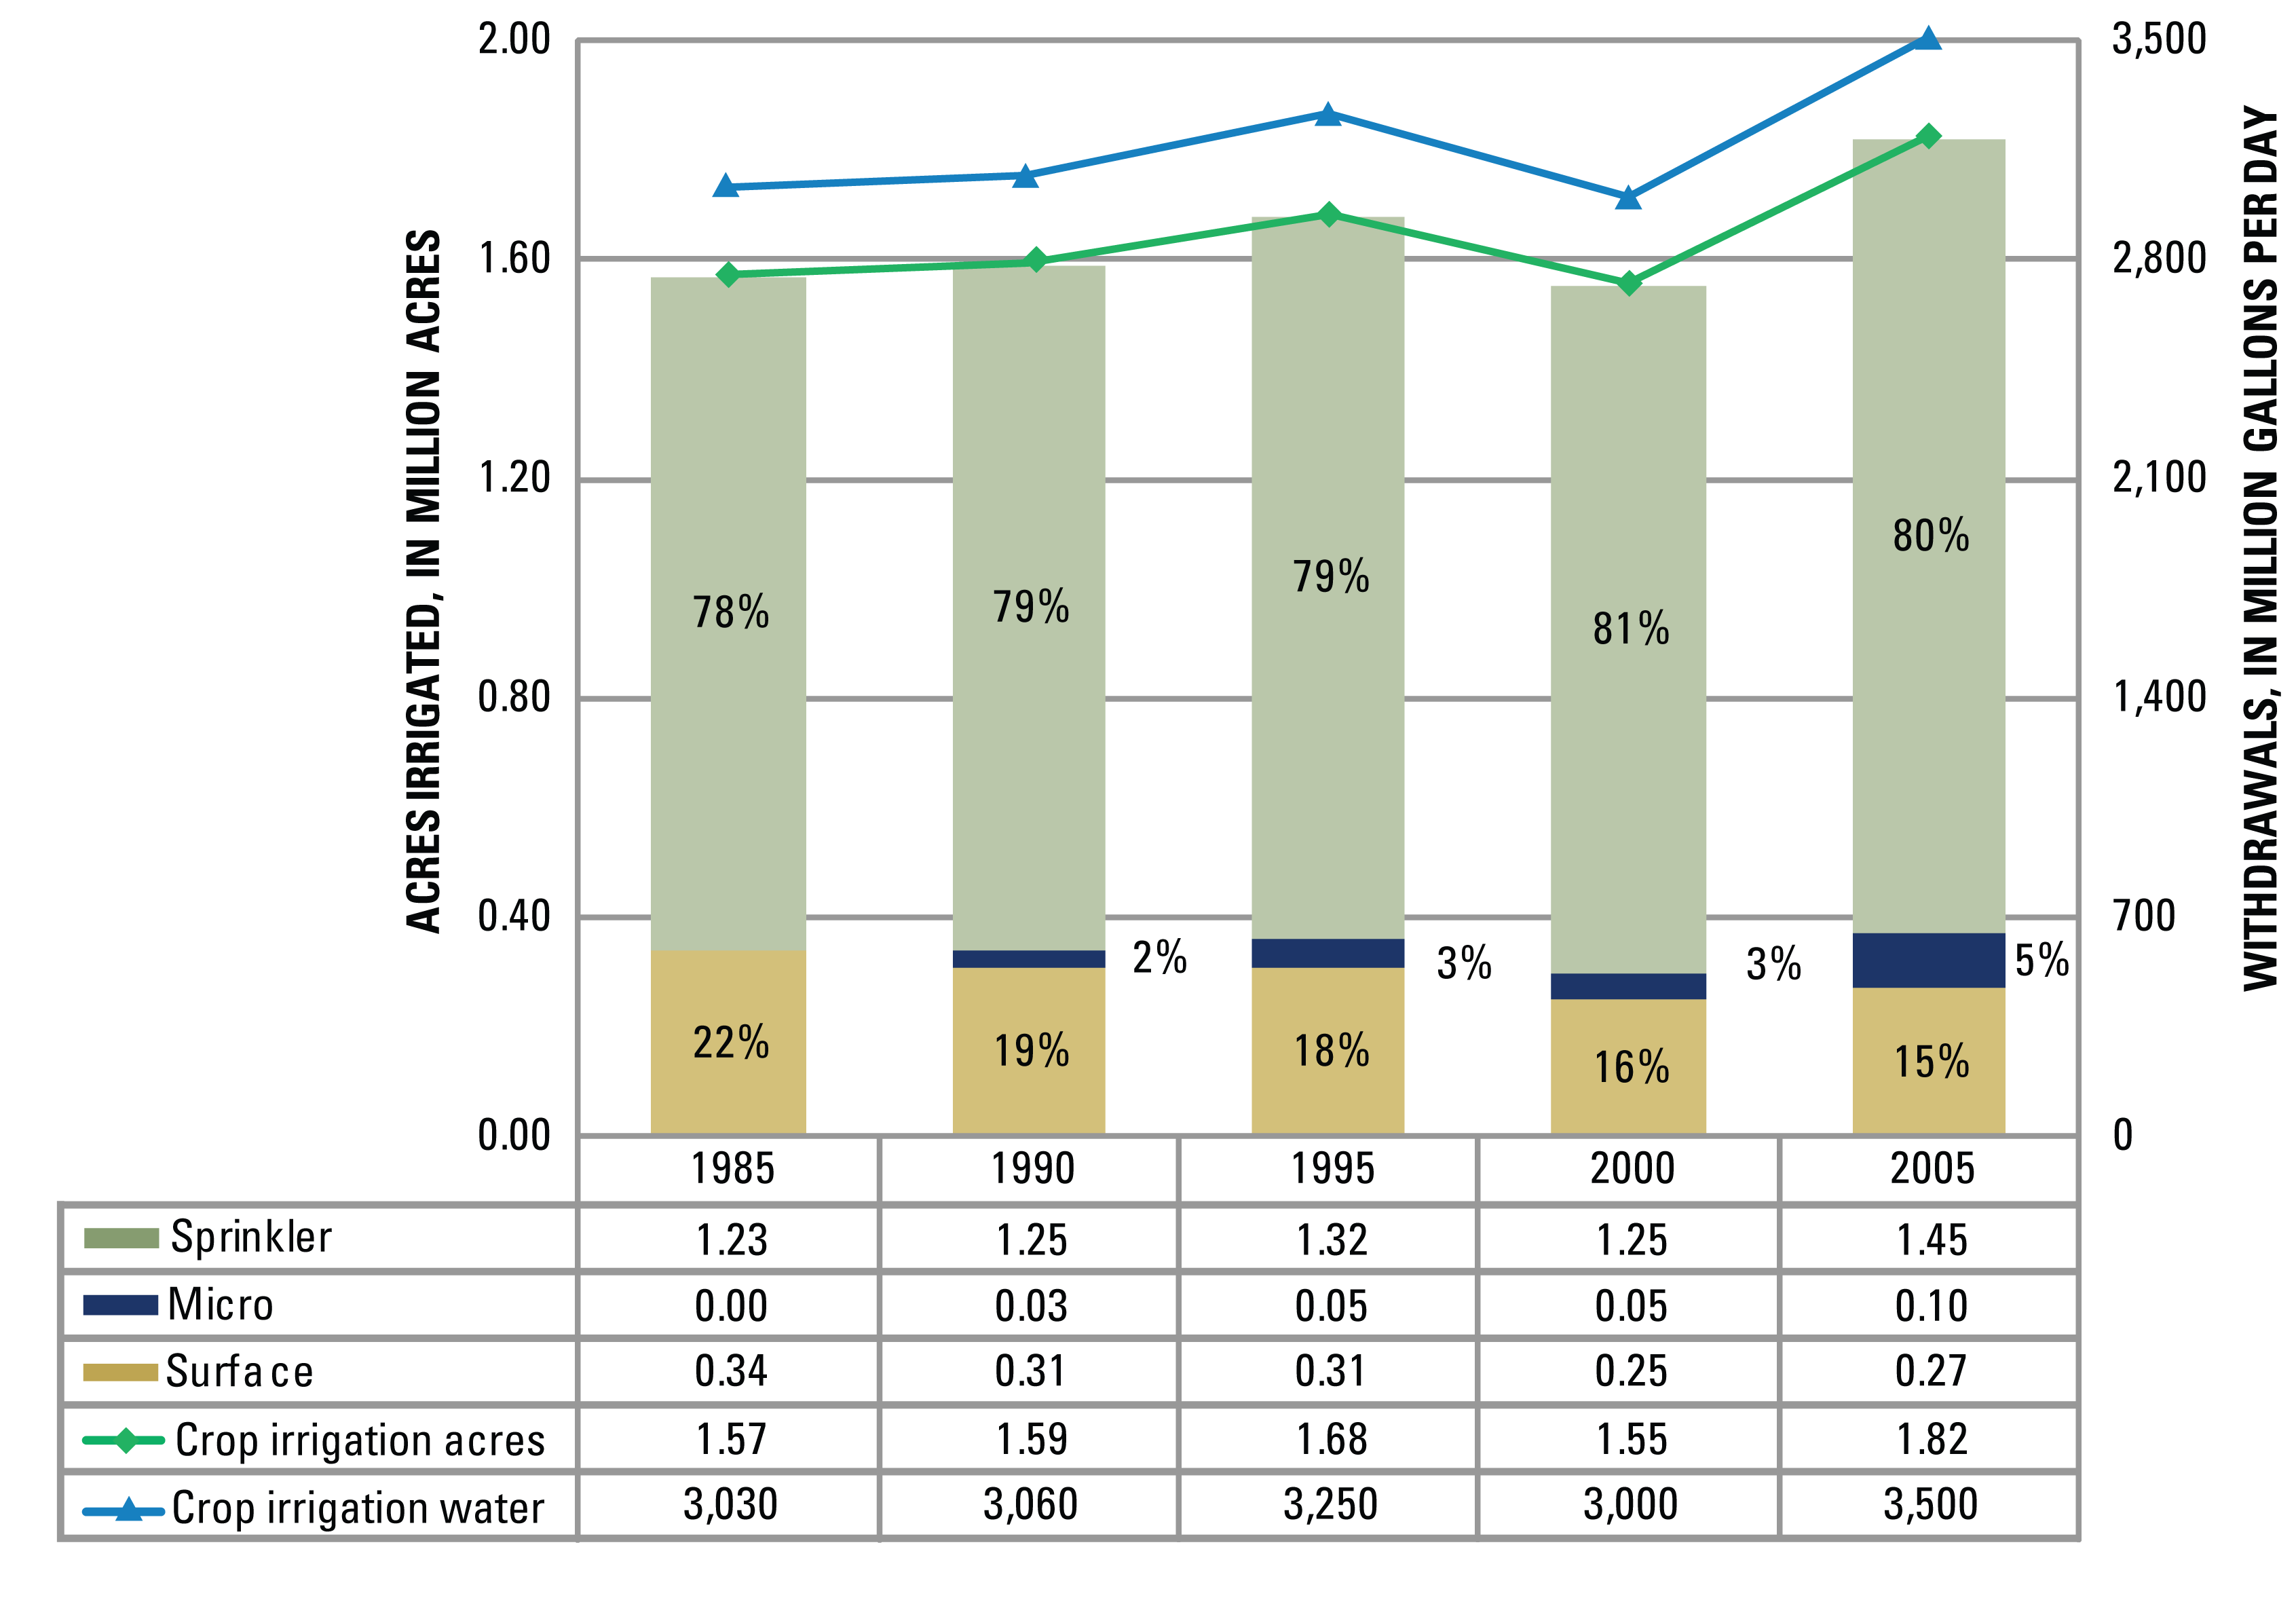 Figure 6. Crop-irrigation acreage and application methods. Public Inquiries and Data RequestsInquiries and requests for data and reports may be made online at the WAWSC web page, http://wa.water.usgs.gov/pubinfo/ Washington Water Science Center at: |
For additional information contact: Part or all of this report is presented in Portable Document Format (PDF); the latest version of Adobe Reader or similar software is required to view it. Download the latest version of Adobe Reader, free of charge. |
Lane, R.C., 2010, Water use trends in Washington, 1985–2005: U.S. Geological Survey Fact Sheet 2010-3057, 4 p.

![]() U.S. Department of the Interior |
U.S. Geological Survey
U.S. Department of the Interior |
U.S. Geological Survey
URL: http://pubsdata.usgs.gov/pubs/fs/2010/3057/index.html
Page Contact Information: GS Pubs Web Contact
Page Last Modified: Tuesday, 29-Nov-2016 17:40:06 EST
