Fact Sheet 2012–3111
The San Francisco Bay Study Unit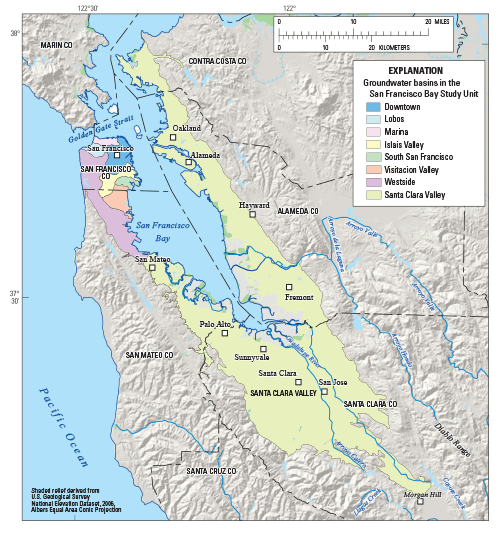
The San Francisco Bay study unit is approximately 620 square miles and consists of the Marina, Lobos, Downtown, Islais Valley, South San Francisco, Visitacion Valley, Westside, and the Santa Clara Valley groundwater basins (California Department of Water Resources, 2003). These basins were grouped into one study area primarily on the basis of geography (Ray and others, 2009). The study unit has warm, dry summers and cool, moist winters. Average yearly rainfall across the study unit ranges from 14 inches (in.) in the southern and southwestern parts of the study unit to 28 in. in the north. The study unit is drained primarily by the Guadalupe River, the Coyote Creek, and their principal tributaries. The primary aquifer system consists of alluvial sediments (mixtures of sand, silt, clay, and gravel), fluvial deposits, and marine estuarine deposits (locally referred to as the “Bay Mud”). For this study, the primary aquifer system is defined as the part of the aquifer corresponding to the perforated intervals of public-supply wells listed in the California Department of Public Health database. Public-supply wells are typically drilled to depths between 200 and 700 feet, consist of solid casing from the land surface to a depth of about 175 to 425 feet, and are perforated below the solid casing. Water quality in the shallower and deeper parts of the aquifer system may differ from that in the primary aquifer system. Land use in the study unit is approximately 77 percent (%) urban, 22% natural, and 1% agricultural. The largest urban areas are the cities of San Francisco, San Jose, Santa Clara, Sunnyvale, Fremont, and Oakland. Natural lands are mostly grassland. Recharge to groundwater occurs primarily from infiltration of imported water, mountain-front recharge, streamflow, infiltration of water from precipitation and irrigation, and leakage from transmission pipelines. The primary sources of discharge are water pumped for irrigation and municipal supply, evaporation, and discharge to streams and the San Francisco Bay. Overview of Water Quality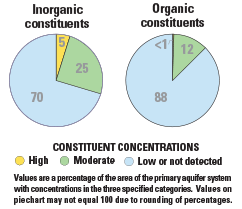
GAMA’s Priority Basin Project evaluates the quality of untreated groundwater. However, for context, benchmarks established for drinking-water quality are used for comparison. Benchmarks and definitions of high, moderate, and low concentrations are discussed in the inset box on page 3. Many inorganic constituents occur naturally in groundwater. The concentrations of the inorganic constituents can be affected by natural processes as well as by human activities. In the San Francisco Bay study unit, one or more inorganic constituents were present at high concentrations in about 5% of the primary aquifer system and at moderate concentrations in about 25%. Human-made organic constituents are found in products used in the home, business, industry, and agriculture. Organic constituents can enter the environment through normal usage, spills, or improper disposal. In this study unit, one or more organic constituents were present at high concentrations in less than 1% of the primary aquifer system and at moderate concentrations in about 12%. RESULTS: Groundwater Quality in the San Francisco Bay Study Unit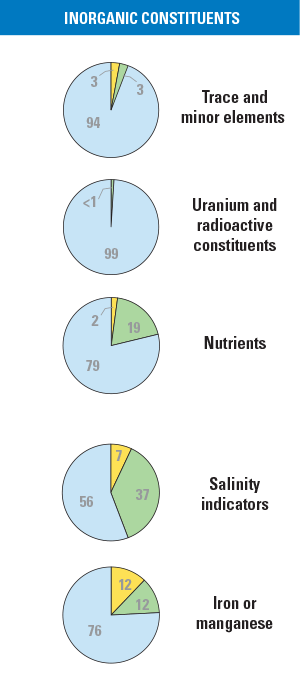
Inorganic Constituents with Human-Health BenchmarksTrace and minor elements are naturally present in the minerals in rocks and soils and in the water that comes into contact with those materials. In the San Francisco Bay study unit, barium was the only trace element detected at high concentrations (in about 3% of the primary aquifer system). Radioactivity is the release of energy or energetic particles during spontaneous decay of unstable atoms. Most of the radioactivity in groundwater comes from the decay of naturally occurring isotopes of uranium and thorium in minerals in the sediments of the aquifer. Radioactive constituents were not detected at high concentrations in the primary aquifer system, and were detected at moderate concentrations in <1% based on the spatially weighted approach. Nutrients, such as nitrate and nitrite, can be naturally present at low concentrations in groundwater. High and moderate concentrations generally occur as a result of human activities, such as applying fertilizer to crops. Livestock, when in concentrated numbers, and septic systems also produce nitrogenous waste that can leach into groundwater. Nutrients were present at high concentrations in about 2% of the primary aquifer system and at moderate concentrations in about 19% of the primary aquifer system. Inorganic Constituents with Non-Health Benchmarks(Not included in water-quality overview charts shown on the front page) Some constituents affect the aesthetic properties of water, such as taste, color, and odor, or may create nuisance problems, such as scaling and staining. The State of California has a recommended and an upper limit for total dissolved solids (TDS) in drinking water. All groundwater naturally contains TDS as a result of the weathering and dissolution of minerals in the sediments. Anoxic conditions in groundwater (low amounts of dissolved oxygen) may result in release of manganese and iron from minerals into groundwater. In the San Francisco Bay study unit, salinity indicator concentrations (TDS and/or chloride) were high in about 7% of the primary aquifer system. About 37% of the primary aquifer system had moderate concentrations of salinity indicators. Iron and manganese are naturally occurring elements, and they were present (one or both) at high concentrations in about 12% of the primary aquifer system and at moderate concentrations in about 12% of the primary aquifer system. 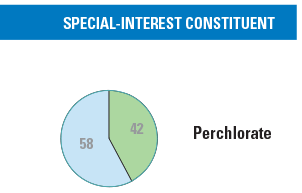
Perchlorate(Not included in water-quality overview charts shown on the front page) Perchlorate is an inorganic constituent which has been regulated in California drinking water since 2007. It is an ingredient in rocket fuel, fireworks, and other products, may be present in some fertilizers, and occurs at low concentrations under natural conditions in groundwater. Perchlorate was not detected at high concentrations in the primary aquifer system and was detected at moderate concentrations in 42%. 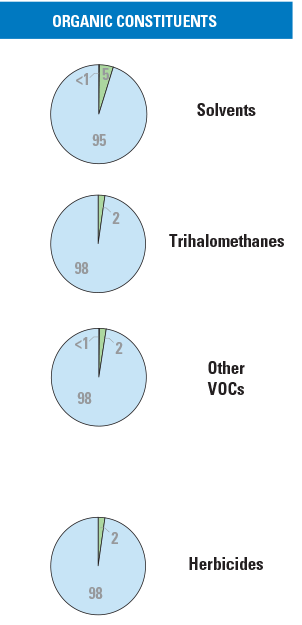
Organic ConstituentsThe Priority Basin Project uses laboratory methods that can detect low concentrations of volatile organic compounds (VOCs) and pesticides, far below human-health benchmarks. The presence of VOCs and pesticides detected at these low concentrations can be used to trace water from the landscape into the aquifer system. Volatile Organic Compounds with Human-Health BenchmarksVOCs are used in many household, commercial, industrial, and agricultural products and are characterized by their tendency to volatilize (evaporate) into the air. Solvents are used for a number of purposes, including manufacturing and cleaning. In the San Francisco Bay study unit, solvents were present at high concentrations in less than (<) 1% of the primary aquifer system. The solvent detected at high concentrations was tetrachloroethene. Solvents were detected at moderate concentrations (mainly tetrachloroethene and trichloroethene) in about 5% of the primary aquifer system. Trihalomethanes may form during municipal water purification and can enter groundwater by the infiltration of landscape irrigation water. Trihalomethanes were detected at moderate concentrations in about 2% of the primary aquifer system. Other VOCs include organic synthesis reagents and gasoline additives. Other VOCs were detected at high concentrations in <1% of the primary aquifer system and at moderate concentrations in about 2% of the primary aquifer system. The compound detected at high concentrations was the gasoline additive methyl tert-butyl ether (MTBE). Pesticides with Human-Health BenchmarksPesticides are applied to crops, gardens, lawns, around buildings, and along roads to help control unwanted vegetation (weeds), insects, fungi, and other pests. In the San Francisco Bay study unit, insecticides (including fumigants) were not detected at high or moderate concentrations in the primary aquifer system. Herbicides were detected at moderate concentrations in about 2% of the primary aquifer system, reflecting moderate concentrations of atrazine. BENCHMARKS FOR EVALUATING GROUNDWATER QUALITY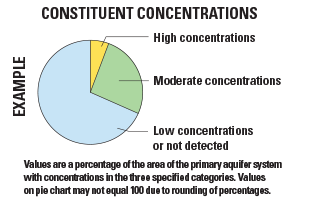
GAMA’s Priority Basin Project uses benchmarks established for drinking water to provide context for evaluating the quality of untreated groundwater. After withdrawal, groundwater may be disinfected, filtered, mixed, and exposed to the atmosphere before being delivered to consumers. Federal and California regulatory benchmarks for protecting human health (Maximum Contaminant Level, MCL) were used for the evaluation when available. Otherwise, non-regulatory benchmarks for protecting aesthetic properties (Secondary Maximum Contaminant Level, SMCL), such as taste and odor, and non-regulatory benchmarks for protecting human health (Notification Level, NL, and Lifetime Health Advisory, HAL) were used. High, moderate, and low concentrations are defined relative to benchmarksConcentrations are considered high if they are greater than a benchmark. For inorganic constituents, concentrations are moderate if they are greater than one-half of a benchmark. For organic and special-interest constituents, concentrations are moderate if they are greater than one-tenth of a benchmark; this lower threshold was used because organic constituents generally are less prevalent and have smaller concentrations relative to benchmarks than inorganic constituents. Low includes nondetections and values less than moderate concentrations. Methods for evaluating water quality are discussed in Parsons and others (2013). Salinity in the San Francisco Bay Study UnitIn the San Francisco Bay study unit, inorganic constituents with health-based benchmarks—trace elements, nutrients, and radioactive constituents—are present at high concentrations in about 5% of the primary aquifer system. In contrast, in most areas investigated by the GAMA Priority Basin Project, inorganic constituents are present at high concentrations in 10 to 25% of the primary aquifer system. The constituent present at high concentrations in the greatest proportion of the primary aquifer system was TDS, which is an indicator of salinity that has an SMCL (an aesthetic-based benchmark). In California, the SMCL for TDS is 1,000 milligrams per liter (mg/L), whereas the U.S. Environmental Protection Agency SMCL for TDS is 500 mg/L. TDS was present at high concentrations (greater than 1,000 mg/L) in 7% of the primary aquifer system and at moderate concentrations (between 500 and 1,000 mg/L) in 37%. Natural sources of TDS to groundwater in the San Francisco Bay study unit include saltwater intrusion from the Bay and interaction between recharge water and aquifer materials derived from marine or estuarine sediments. On the east side of the Bay, high and moderate concentrations of TDS were detected in areas with a history of intrusion of water from the Bay in response to pumping of freshwater from aquifers. Continuous pumping in the Niles Cone sub-basin allowed these saline waters to migrate from the shallow aquifers through the Bay Mud to deeper aquifers used for public supply (Figuers, 1998). On the southwest side of the Bay, moderate concentrations of TDS occur on an alluvial fan near the town of Atherton. Upwelling of connate saline water from marine sediments may be a source of TDS to these aquifers (Metzger and Fio, 1997). On the east side of the Santa Clara Valley, moderate concentrations of TDS occur in wells along Coyote Creek, which drains marine sediments in the Diablo Range to the east of the study unit and also receives water from various impoundments in the southern part of the valley for groundwater recharge. Accumulation of salts in Coyote Creek along the flowpath from both of these waters may be a source of TDS to the aquifers. 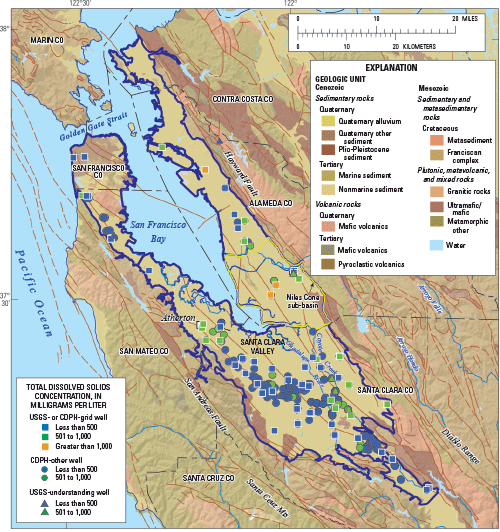
Priority Basin AssessmentsGAMA’s Priority Basin Project (PBP) assesses water quality in that part of the aquifer system used for drinking water, primarily public supply. Water quality in the primary aquifer system may differ from water quality in shallower and deeper parts of the aquifers. GAMA’s Domestic Well Project assesses water quality in the shallower parts of the aquifer system. Ongoing PBP assessments are being conducted in more than 120 basins throughout California. The PBP assessments are based on a comparison of constituent concentrations in untreated groundwater with benchmarks established for the protection of human health and for aesthetic concerns. The PBP does not evaluate the quality of drinking water delivered to consumers. The PBP uses two scientific approaches for assessing groundwater quality. The first approach uses a network of wells to statistically assess the status of groundwater quality. The second approach combines water-quality, hydrologic, geographic, and other data to help assess the factors that affect water quality. In the San Francisco Bay study unit, data were collected by the PBP in 2007 and from the CDPH database for 2004–2007. The PBP includes chemical analyses not generally available as part of regulatory compliance monitoring, including measurements at concentrations much lower than human-health benchmarks, and measurement of constituents that can be used to trace the sources and movement of groundwater. SELECTED REFERENCESCalifornia Department of Water Resources, 2003, California’s groundwater: California Department of Water Resources Bulletin 118, 246 p., accessed September 7, 2012, at http://www.water.ca.gov/groundwater/bulletin118/update2003.cfm. Figuers, S., 1998, Groundwater study and water supply history of the East Bay Plain, Alameda and Contra Costa Counties, CA: Norfleet Consultants Project Number 971102, 90 p., accessed September 7, 2012, at http://www.waterboards.ca.gov/sanfranciscobay/water_issues/programs/groundwater/ Metzger, L.F., and Fio, J.L., 1997, Ground-water development and the effects on ground-water levels and water quality in the town of Atherton, San Mateo County, California: U.S. Geological Survey Water-Resources Investigations Report 97-4033, 31 p. (Also available at https://pubs.usgs.gov/wri/1997/4033/report.pdf.) Parsons, M.C., Kulongoski, J.T., and Belitz, Kenneth, 2013, Status and understanding of groundwater quality in the San Francisco Bay groundwater basins, 2007—California GAMA Priority Basin Project: U.S. Geological Survey Scientific Investigations Report 2012-5248, 74 p. (Also available at https://pubs.usgs.gov/sir/2012/5248.) Ray, M.C., Kulongoski, J.T., and Belitz, Kenneth, 2009, Ground-water quality data in the San Francisco Bay study unit, 2007—Results from the California GAMA Program: U.S. Geological Survey Data Series 396, 92 p. (Also available at https://pubs.usgs.gov/ds/396.) |
First posted March 29, 2013
For additional information contact: Technical reports and hydrologic data collected for the GAMA Program may be obtained from GAMA Project Chief GAMA Program Unit Chief Part or all of this report is presented in Portable Document Format (PDF); the latest version of Adobe Reader or similar software is required to view it. Download the latest version of Adobe Reader, free of charge. |
Parsons, M.C., Kulongoski, J.T., and Belitz, Kenneth, 2013, Groundwater quality in the San Francisco Bay groundwater basins, California: U.S. Geological Survey Fact Sheet 2012–3111, 4 p.

![]() U.S. Department of the Interior |
U.S. Geological Survey
U.S. Department of the Interior |
U.S. Geological Survey
URL: http://pubsdata.usgs.gov/pubs/fs/2012/3111/index.html
Page Contact Information: GS Pubs Web Contact
Page Last Modified: Tuesday, 29-Nov-2016 18:34:01 EST
