
The U.S. Geological Survey (USGS) investigates the occurrence, quantity, quality, distribution, and movement of the surface and underground waters that constitute the Nation's water resources. The USGS is the principal Federal water-data agency that collects and disseminates the data being used by State and local governments, public and private utilities, and other Federal agencies to develop and manage our water resources. Data are collected by USGS personnel in all 50 States, plus Puerto Rico and Guam. These hydrologic data are used not only for determining the adequacy of water supplies, but also for implementing flood-warning systems; designing dams, bridges, and flood control projects; allocating irrigation water; locating sources of pollution, planning for energy development; and predicting the potential effects of radioactive waste disposal on water supplies.
As part of the Survey's program of disseminating water data to the public, the Water Resources Division (WRD) maintains a distributed network of computers and fileservers for the storage and retrieval of water data collected through its activities at approximately 1.4 million sites. This system is called the National Water Information System (NWIS).
The NWIS is a distributed water database in which data can be processed over a network of workstations and fileservers at Survey offices throughout the United States. The system is composed of four subsystems: the Ground-Water Site-Inventory System, the Water-Quality System, the Automated Data-Processing System, and the Water-Use Data System.
Many types of data are stored in the NWIS' distributed, local data bases, including:
The NWIS structure and the types of data available in the four subsystems are shown in figure 1.
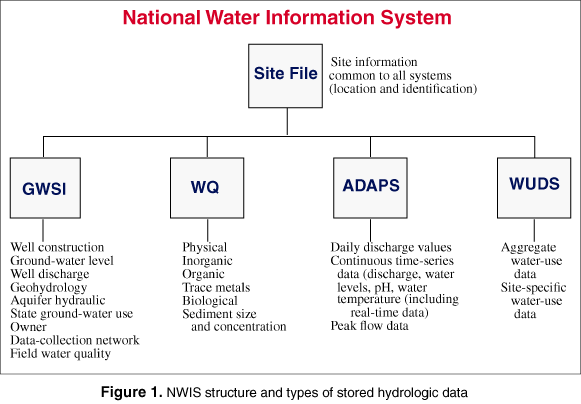
The Ground-Water Site-Inventory (GWSI) System contains and provides access to inventory information about sites at stream reaches, wells, test holes, springs, tunnels, drains, lakes, reservoirs, ponds, excavations, and water-use facilities. The system also provides for entering new sites within the local database.
Approximately 300 components make up the descriptive elements of the GWSI. These components are stored in one general data file called the Site File, which contains site information common to all subsystems of the NWIS, and eight GWSI data files that contain ground-water-related information. The eight GWSI data files contain well-construction, ground-water level, ground-water well or spring discharge, geohydrologic characteristics, observation-well report header, aquifer hydraulic, State ground-water use, and miscellaneous data.
The GWSI retrieval program can be used for retrieving information from the Site File and the associated GWSI files to generate two types of general data tables, four types of water-level tables, or a file suitable for input to other programs.
Through the system menu, the GWSI System maintains the local databases and performs other administrative tasks, including data dictionary modifications and site identification changes, and provides programs for entering field data into files used to update the local database.
The Water-Quality (WQ) System contains results of more than 3.5 million analyses of water samples that describe the chemical, physical, biological, and radiochemical characteristics of both surface and ground waters. Types of chemical data include filtered and/or unfiltered concentrations of major ions, trace elements, nutrients, pesticides, base-neutral organics, acid organics, and volatile organic compounds. Physical characteristics data include pH, specific conductance, water and air temperature, dissolved oxygen, barometric pressure, and percent dissolved oxygen saturation.
Water samples data are analyzed at laboratories equipped to perform chemical analyses ranging from determinations of simple inorganic compounds, such as chlorides, to complex organic compounds, such as pesticides. As each analysis is completed, the results are verified by laboratory personnel and transmitted to the originator of the data by use of a computer, and then stored in their water-quality database.
Sediment data in the Water-Quality System include suspended-sediment concentrations in water, sediment-size distributions, and chemical concentrations of suspended sediments and bottom sediments. Biological data in the system include population densities and diversity indexes of periphyton, phytoplankton, and benthic invertebrates.
The system can produce three types of tables of water-quality data and one table of biological population data. Types of summary tables include frequency percentiles; analytical detection limits; sample summary; and alert limits. Several standard output formats, such as flatfile and the 1- and *- format, are available for input to applications. The system's graphic outputs include: X-Y plots, regression plots, boxplots, time-series plots, Stiff diagrams, and Piper diagrams.
The Automated Data Processing System (ADAPS) contains more than 850,000 station years of time-series data that describe stream-water levels, streamflow (discharge), reservoir water levels, surface-water quality, ground-water levels, and rainfall. ADAPS consists of a collection of computer programs and databases.
The water data stored in ADAPS results from the processing of data collected by automated recorders and by observations and manual measurements at field installations around the Nation. The data from these sites are transported by field personnel or are relayed through telephones or satellites to offices where USGS personnel, using ADAPS procedures, process the data.
The data relayed through the Geostationary Operational Environmental Satellite (GOES) system are processed automatically in near-real time, and in many cases are available within minutes at the local USGS Web pages.
The Water-Use Data System (WUDS) stores summary data on water use throughout the Nation and includes two database systems: the Site-Specific Water-Use Data System (SWUDS), and the Aggregate Water-Use Data System (AWUDS). SWUDS stores measurements and estimates of water use by individual users. AWUDS stores aggregated estimates of water use by county, hydrologic unit, and aquifer. The WUDS is used to enter and update existing water-use data. and to provide retrievals and displays of data that are stored in a local database.
General assistance in the operation and application of NWIS is available
from the NWIS office in Reston, VA.,
(Email:
nwis_help@mailnwis.er.usgs.gov).
Water data are available at local Web sites that can be accessed
at
http://water.usgs.gov/
Contact information for the USGS State Representatives is available at
http://water.usgs.gov/staterep.html.
The contact's name, address, email address, telephone and
facsimile numbers, and open hours are included for each
office.
The following are District offices for the Water Resources Division.
ALABAMA, Montgomery
ALASKA, Anchorage
ARIZONA, Tucson
ARKANSAS, Little Rock
CALIFORNIA, Sacramento
COLORADO, Lakewood
CONNECTICUT, Hartford
FLORIDA, Tallahassee
GEORGIA, Atlanta
HAWAII, Honolulu
(includes American Samoa and Guam)
IDAHO, Boise
ILLINOIS, Urbana
INDIANA, Indianapolis
IOWA, Iowa City
KANSAS, Lawrence
KENTUCKY, Louisville
MAINE, Augusta
LOUISIANA, Baton Rouge
MARYLAND, Baltimore
(includes Delaware and the
District of Columbia)
MASSACHUSETTS, Marlborough (includes Rhode Island)
MICHIGAN, Lansing
MINNESOTA, Mounds View
MISSISSIPPI, Pearl
MISSOURI, Rolla
MONTANA, Helena
NEBRASKA, Lincoln
NEVADA, Carson City
NEW HAMPSHIRE, Pembroke
(includes Vermont)
NEW JERSEY, West Trenton
NEW MEXICO, Albuquerque
NEW YORK, Troy
NORTH CAROLINA, Raleigh
NORTH DAKOTA, Bismarck
OHIO, Columbus
OKLAHOMA, Oklahoma City
OREGON, Portland
PENNSYLVANIA, Lemoyne
PUERTO RICO, Guaynabo
(includes the Virgin Islands)
SOUTH CAROLINA, Columbia
SOUTH DAKOTA, Rapid City
TENNESSEE, Nashville
TEXAS, Austin
UTAH, Salt Lake City
VIRGINIA, Richmond
WASHINGTON, Tacoma
WEST VIRGINIA, Charleston
WISCONSIN, Middleton
WYOMING, Cheyenne
U.S. Geological Survey,
Fact Sheet FS-027-98
This fact sheet is also available in pdf format:
![]() fs-027-98.pdf [97K]
fs-027-98.pdf [97K]