![]()
Photo from U.S. Geological Fact Sheet 168-97
|
|
|
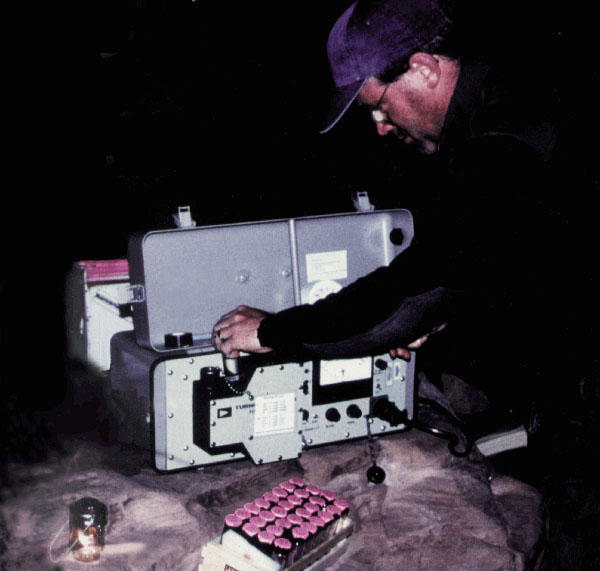
Figure 7. At each site, water samples were collected from near the riverbank during passage of the dye and measured in the field for dye concentration using a fluorometer. At the site pictured, the dye concentration peaked at around midnight. Samples from all sites were retained and remeasured in the lab under controlled temperature conditions to obtain the final concentrations. |