
| U.S. Geological Survey Fact Sheet FS-058-99 | April 1999 |
Fact: Lakes, reservoirs, and peatlands collectively cover less than 2 percent of the Earth's surface but bury organic carbon at an annual rate that is four times the carbon burial rate in all oceans, which cover 71 percent of the Earth's surface.
Carbon Burial in Lakes
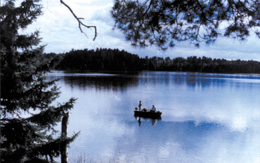 Elk Lake, Minnesota, is typical of the many lakes in glaciated parts of the Midwestern United States that bury organic carbon at a rate of about 72 g/m2/yr. |
| Table 1. Burial of organic carbon. [OC, organic carbon. Large lakes include 28 lakes, each with an area greater than 5,000 km2] | ||||||
| Location of sediment carbon sink | Area of carbon sink (x1012 m2) | OC burial rate (g/m2/yr) | Amount of OC buried (x1012 g/yr) | |||
|---|---|---|---|---|---|---|
| Carbon burial in lakes, reservoirs, and peatlands | ||||||
| LAKES | ||||||
| Large | 1.18 | 5 | 6 | |||
| Small | 0.32 | 72 | 23 | |||
| Inland seas | 1.00 | 5 | 5 | |||
| Total | 2.50a | ........2.50a | 34a | |||
| 60b | ||||||
| 48-72c | ||||||
| 54d | ...........54d | |||||
| RESERVOIRS | 0.40a | 400 | 160a | |||
| 0.66c | 300-400c | |||||
| 0.66c | 200b | |||||
| 0.53d | ........0.53d | 265d | ..........265d | |||
| PEATLANDS (present) | 3.30e | ........3.30e | 29 | 96e | ..............96e | |
| TOTAL "LAND" | 6.33 | 415 | ||||
| (lakes, reservoirs, peatlands) | ||||||
| Carbon burial in the world's oceans | ||||||
| OCEANS | ||||||
| Margins | 42f | |||||
| Basins | 320f | |||||
| Total | 362f | ..........362f | 60-130f | |||
| 82g | ||||||
| 115h | ||||||
| 97d | ..............97d | |||||
| TOTAL "OCEAN" | 362 | 97 | ||||
| "Land"/"Ocean" quotient | 0.02 | 4.3 | ||||
aDean and Gorham (1998). bMulholland and Elwood (1982). cStallard (1998). dMean of above estimates. eGorham (1991). fEmerson and Hedges (1988). gSundquist (1985). hArthur and others (1985).
Carbon Burial in Reservoirs
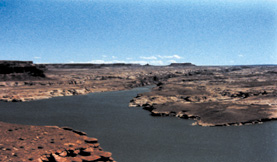 Lake Powell, Utah, was formed by the damming of the Colorado River behind Glen Canyon dam at Page, Arizona. The drainage basin of the Colorado River is underlain mostly by soft, easily eroded sandstones and shales. The tremendous sediment load delivered to Lake Powell by the Colorado and its upstream tributaries, the Green and Gunnison Rivers, results in the rapid accumulation of sediment behind Glen Canyon dam. The high sediment-accumulation rates in reservoirs globally results in an estimated organic-carbon burial rate in reservoirs of about 400 g/m2/yr. |
Carbon Burial in Peatlands
Wetlands that accumulate more than 30 cm of organic peat are called peatlands (Gorham, 1991). In Europe, they are called mires. Peatlands are concentrated in northern Russia, the Baltic States, Fennoscandia, Canada, and the Northern United States (particularly in Alaska) where they make up 9.7 percent of the total land surface (Gorham, 1995). It is estimated that the total area of unmined northern peatlands is 3.3x10¹² m2 (Gorham, 1991). The estimated present average rate of OC accumulation in northern peatlands is 29 g/m2/yr (Gorham, 1991). Using this rate for all northern peatlands, their total OC burial amounts to 96 Tg/yr (table 1).
 A forested peatland, Shingobee Fen, in northwestern Minnesota. Unlike bogs that receive moisture from precipitation and feed the ground-water table, fens are fed by ground water. This forested fen receives a large discharge of nutrient-rich ground water that provides an environment for rare aquatic plants. |
Carbon Burial in Oceans
Globally, continental margins only amount to 12 percent of the area of the world oceans, but they are estimated to account for 44 percent of the present burial of OC in the oceans (Emerson and Hedges, 1988). Very little OC accumulates in the deep ocean basins, mainly because any organic matter produced in surface waters decomposes before it gets to the bottom. Estimates of OC burial in all oceans of the world vary, but tend to be about 100 Tg/yr (table 1).
Conclusions
The total annual OC accumulation in lakes (54 Tg), reservoirs (265 Tg), and northern peatlands (96 Tg) is 415 Tg (table 1). Despite the total area of these three carbon sinks being only about 2 percent of the world ocean's surface area, they bury more than four times more carbon than the oceans (table 1).It should be noted that the drainage of peatlands for forestry and agriculture, and use of peat as fuel, is releasing carbon to the atmosphere. Gorham (1991) estimated that such processes release about 35 Tg/yr from northern peatlands, and more southerly regions may actually be releasing more carbon from drained peatlends than is fixed in undrained sites. On the other hand, cultural eutrophication may have increased lake sedimentation of OC four- to five-fold in small lakes, an increase of 23-32 Tg/yr.
References Cited
Arthur, M.A., Dean, W.E., and Schlanger, S.O., 1985, Variations in the global carbon cycle during the Cretaceous related to climate, volcanism, and changes in atmospheric CO2, in Sundquist, E.T., and Broecker, W.S., eds., The Carbon Cycle and Atmospheric CO2: Natural Variations, Archean to Present: American Geophysical Union Geophysical Monograph 32, p. 504-529.Dean, W.E., and Gorham, E., 1998, Magnitude and significance of carbon burial in lakes, reservoirs, and peatlands: Geology, v. 26, p. 535-538.
Emerson, S., and Hedges, J.I., 1988, Processes controlling the organic carbon content of open ocean sediments: Paleoceanography, v. 3, p. 621-634.
Gorham, E., 1991, Northern peatlands: Role in the carbon cycle and probable responses to climatic warming: Ecological Applications, v. 1, p. 182-195.
1995, The biogeochemistry of northern peatlands and its possible responses to global warming, in Woodwell, G.M., and MacKenzie, F.T., eds., Biotic Feedbacks in the Global Climatic System: Will the Warming Speed the Warming?: Oxford, Oxford University Press, p. 169-186.
Mulholland, P.J., and Elwood, J.W., 1982, The role of lake and reservoir sediments as sinks in the perturbed global carbon cycle: Tellus, v. 34, p. 490-499.
Richie, J.C., 1989, Carbon content of sediments of small reservoirs: Water Resources Bulletin, v. 25, p. 301-308.
Shiklomanov, I.A., 1993, World fresh water resources, in Glick, P. H., ed., Water in Crisis: Oxford, Oxford University Press, p. 13-24.
Stallard, R.F., 1998, Terrestrial sedimentation and the carbon cycle: Coupling weathering and erosion to carbon burial: Global Biogeochemical Cycles, v. 12, p. 231-257.
Sundquist, E.T., 1985, Geological perspectives on carbon dioxide and the carbon cycle, in Sundquist, E.T., and Broecker, W.S., eds., The Carbon Cycle and Atmospheric CO2: Natural Variations, Archean to Present: American Geophysical Union Geophysical Monograph 32, p. 5-59.
For additional information, contact:
Walter E. Dean
U.S. Geological Survey
P.O. Box 25046, Mail Stop 980
Denver, CO 80225-0046
303-236-5760 phone
303-236-5349 Fax
dean@usgs.gov
| AccessibilityFOIAPrivacyPolicies and Notices | |
| |
|