This report is available in pdf 2MB.
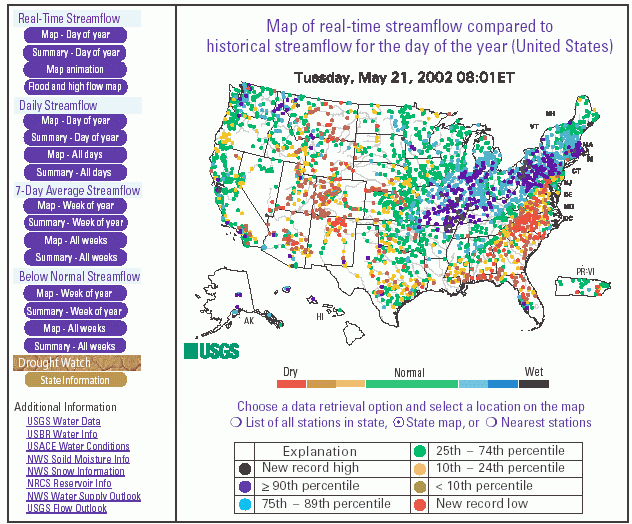
WaterWatch is the official U.S. Geological Survey (USGS) website for
maps and graphs, showing real-time streamflow conditions in the United States
and Puerto Rico. Located at http://water.usgs.gov/waterwatch/ WaterWatch maps depict current streamflow as colorcoded dots at
about 3,000 streamgages. The colors represent percentiles of streamflow that
are calculated from historical observations for the current day of the year.
Only stations having at least 30 years of continuous record are used to ensure
that the calculated percentiles are representative of historical conditions.
Seven categories of streamflow are shown on WaterWatch maps: new record high
for the day (black); ![]() 90th percentile
(dark blue); 75th-89th percentile (light blue); 25th-74th percentile (green);
10th-24th percentile (orange); <10th percentile (brown); and new record low
for the day (red).
90th percentile
(dark blue); 75th-89th percentile (light blue); 25th-74th percentile (green);
10th-24th percentile (orange); <10th percentile (brown); and new record low
for the day (red).
A major attribute of WaterWatch is a point and click feature that allows users to retrieve maps and graphs of real-time stage and discharge data for individual stations. Maps of State hydrologic conditions can be accessed from the National map, and graphs of recent streamflow at individual streamgages can be obtained from State maps. This feature facilitates rapid assessment of both general and specific water-resources conditions. WaterWatch also serves as a geospatial front end to NWIS-Web, the new USGS online National Water Information System that provides access via home or office computer to real-time and historical surface-water, ground-water, and water-quality data. Access to data (including real-time streamflow and historical flood peaks) via NWIS-Web can be obtained at http://waterdata.usgs.gov/nwis/ . To provide users with a broad perspective on short-term and long-term streamflow conditions and variations, WaterWatch maps and graphs are organized into three distinct categories: realtime, daily, and 7-day average streamflow.
The "Real-time streamflow" map tracks rapid changes in rivers and streams. The map is refreshed hourly with the data at each streamgage generally updated every 4 hours, although during flood conditions, the map can be updated more frequently. The general appearance of the map changes very little from one hour to the next, however, individual sites may change rapidly in response to major rain events or to reservoir releases.
The "Daily streamflow" map depicts average streamflow during the previous day. Although similar in appearance to "Real-time streamflow" maps, "Daily" maps are less likely to reflect the influence of short-term events such as reservoir releases and short-duration precipitation events.
The "7-day average streamflow" map shows the average streamflow during the past 7 days. Averaging streamflow values over an entire week makes this map more indicative of persistent streamflow conditions than either the "Real-time streamflow" or the "Daily streamflow" maps. This map also provides a better indication of the hydrologic response to prolonged wet and dry periods.
In addition to real-time, daily, and weekly information, specialized maps and graphs for flood and high flows as well as drought and low flows are available. The "Flood and high flow" maps show streamgage locations where the water level is currently at or above flood stage (depicted as a black triangle) or at high flow (depicted as blue circles). These maps are based on the flood stages defined by the National Weather Service (NWS) and used for flood forecasting purposes. It should be noted, however, that flood conditions may be more extensive than shown on individual flood and high flow maps because NWS has not identified flood stages at all USGS streamgaging sites.
The "Below normal streamflow" maps show average streamflow conditions for the past 7 days, highlighting locations that are experiencing low flows or hydrologic drought. Averaged over an entire week, these maps are more indicative of long-term streamflow conditions than either the "Real-time streamflow" or the "Daily streamflow"maps.
Streamflow variations through time can be tracked using graphs that depict an index of average streamflow for each State and water-resources region. State and regional index graphs are available for daily and weekly streamflow conditions. The streamflow index, plotted as a red line on the graph, is calculated each day as the average of the streamflow index values for all streamgages in a particular State or water-resources region that have at least 30 years of record. Index values correspond to the following streamflow percentiles: 1 represents the 1st percentile (lowest streamflow on record); 2 is the 2nd to 9th percentiles (much below normal); 3 is the 10th to 24th (below normal); 4 is the 25th to 74th (normal); 5 is the 75th to 89th (above normal); 6 is the 90th to 99th (much above normal); and 7 is the 100th percentile (highest streamflow on record). For each State and region, two index graphs are depicted-one shows values for the past 45 days, and the other shows variations since June 1999.
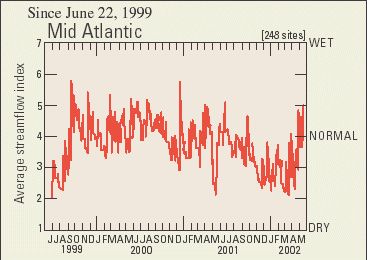 |
| Daily average streamflow conditions for the Mid-Atlantic Water Resources Region from June 22, 1999 to May 21, 2002. |
Daily WaterWatch maps can also be viewed as animations. The daily maps are grouped into monthly animations dating back to June 1999. These animations provide a useful visual characterization of streamflow changes from day to day, particularly in depicting riverine responses to intense precipitation, such as occurs during tropical storms and hurricanes. They also facilitate assessment of the speed with which hydrologic drought can intensify along rivers and streams.
For further information, please contact:
Dr. Harry F. Lins
U.S. Geological Survey
National Center
MS-415
12201 Sunrise Valley Drive
Reston, Virginia 20192
email:hlins@usgs.gov
| AccessibilityFOIAPrivacyPolicies and Notices | |
 |
|