U.S. GEOLOGICAL SURVEY
Fact Sheet 070-01
Sacramento, California 2001
Prepared in cooperation with Sweetwater Authority Sweetwater Authority
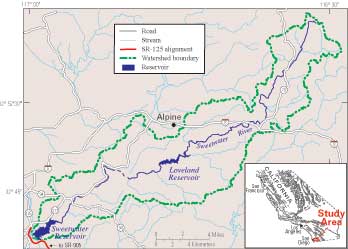
The Sweetwater Reservoir has been supplying water to local residents since 1888 and is presently operated by Sweetwater Authority (Authority) under the guidance of its board of directors. The Authority is the third largest water retailer in San Diego County and serves residential and commercial customers in Chula Vista, National City, and Bonita, California. The water is supplied from a combination of sources, including local surface runoff, ground water, and imported water from the San Diego County Water Authority. The surface runoff--and when needed, imported water--are stored in Sweetwater Reservoir, which is located about 9 miles southeast of San Diego, California. Runoff from the upper watershed is stored in Loveland Reservoir, which is located about 19 miles east of Sweetwater Reservoir, near Alpine, California. The Sweetwater River watershed contains these two reservoirs and covers an area of 180 square miles (fig. 1).
Figure 1. Sweetwater and Loveland Reservoirs, the surrounding watershed, and the proximity of SR-125 to Sweetwater Reservoir.
The Sweetwater River watershed is undergoing a rapid change in land-use patterns as urbanization increases. The watershed includes two Indian reservations; part of the Cleveland National Forest; agricultural land; rural, urban, and suburban residential developments; mining and industrial land use; and commercial recreation and business developments. The watershed also includes four golf courses. The Authority, very concerned with identifying all factors that can degrade water quality, is implementing ways to protect the watershed. These efforts include education of watershed stakeholders, studies to elucidate the relation between water quality and watershed characteristics, and the construction of an urban runoff diversion system. These programs help the Authority to evaluate the environmental health of the watershed by monitoring changes that may degrade the quality of the water supply and by applying additional water treatment if necessary. This report describes a cooperative monitoring study by the Authority and the U.S. Geological Survey (USGS) designed to assess the impact of increasing urbanization on the water quality of Sweetwater Reservoir.
One urban project that has the potential to affect the water quality of Sweetwater Reservoir is the construction and operation of State Route 125 (SR-125). In 1984, the San Diego Association of Governments added SR-125 to the Regional Transportation Plan as part of San Diego's future freeway system. The SR-125 alignment connects SR-125 to SR-905 (fig. 1). The initial project will be a four-lane tollway that will be expanded to eight lanes (Caltrans, 1996). More than 200,000 vehicles per day, including a high percentage (more than 10 percent) of heavy diesel trucks from both the United States and Mexico, are expected to travel the SR-125 alignment when it is completed. The alignment will be upwind of the reservoir, elevated about 100 feet at its highest point, and within 500 feet of the reservoir at its nearest point. Because of these factors, the Authority is concerned that vehicle emissions, as well as road dusts, might enter the reservoir by atmospheric deposition in concentrations that exceed governmental health standards and thus, increase the cost of treating the reservoir water.
In 1998, the USGS began a study to monitor the effects of the construction and operation of the SR-125 alignment on the water quality in Sweetwater Reservoir and to assess the overall health of the watershed with respect to chemical contamination. Three environmental compartments--air, water, and bed sediments--in the Sweetwater watershed are regularly sampled for chemical contaminants:
The study is divided into two phases. During Phase I, the detection frequency and concentration levels of select contaminants in the air, water, and bed sediments are measured. These data will establish baseline conditions for the target compounds of concern to the Authority. During Phase II, sampling will continue at the established monitoring sites during and after the construction of SR-125. The chemical concentrations from Phase II monitoring will be compared with those from Phase I to assess the inputs of organic compounds resulting from changing land-use practices in the watershed and will determine what impact SR-125 has on the water quality of Sweetwater Reservoir.
Many of the sampling and analytical methods used in this study were developed for the USGS's National Water-Quality Assessment Program (Gilliom and others, 1995). The results are entered into the USGS's National Water Information System database so that water-quality data from Sweetwater Reservoir can be compared with data from other water supplies throughout the nation.
The bed sediments in the Sweetwater Reservoir come from a variety of sources. They wash off the surrounding land surface and are transported by the Sweetwater River during rainstorms and water transfers from Loveland Reservoir. They also come from direct deposition of airborne dust and particles. Over time, these sediments accumulate and form a thick layer on the bottom of the reservoir. The chemical composition of the deposited sediments changes over time, thus reflecting the historical activity in the watershed. An analysis of discrete slices of a sediment core provides information on historical water-quality conditions (Charles and Hites, 1987). Sediment samples from the Sweetwater Reservoir were taken using a gravity piston corer (fig. 2).
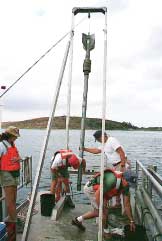
Figure 2. Bed sediment coring at Sweetwater Reservoir.
Two sediment cores, approximately 75 inches in length by 2.5 inches in diameter, were collected from the lower part of Sweetwater Reservoir on September 24, 1998. The sampling site was located in an undisturbed area so that the core sample would reflect the undisturbed, natural sedimentation buildup in the reservoir. One core was subsampled at discrete 1.6-inch intervals, and each segment was analyzed for organochlorine insecticides, industrial compounds, the isotope cesium-137, major and trace elements, grain size, diatoms, and pollens. The second was split lengthwise and inspected for color, texture, odor, organic detritus and benthic invertebrates, and original land-surface material before the Sweetwater dam was built.
The age of the core sections can be estimated from the concentration of anthropogenic compounds, such as cesium-137 and DDT, that were introduced into the environment at known times. Cesium-137, a radioactive by-product of nuclear weapons testing, is deposited into the watershed only from the atmosphere. Measurable concentrations of this isotope first appeared in the atmosphere around 1952 with the advent of large-scale weapons testing, then peaked around 1963 (Pennington and others, 1973). The top of the core was assigned the sampling date (September 1998).
Organochlorine insecticides like DDT are generally characterized by their persistence and toxicity in the environment. DDT use began in 1939 and peaked in the 1960s (Majewski and Capel, 1995). Its widespread use continued in the United States until it was banned in 1972. DDT breaks down into two products, DDE and DDD, that accumulate in sediment and both of which are also toxic and very resistant to further chemical breakdown. DDE and DDD were detected in the Sweetwater Reservoir sediments that were deposited beginning in the late 1940s or early 1950s (fig. 3). The concentration of total DDT (sum of the DDT, DDE, and DDD concentrations) in the sediment deposits peaks around 1964. Together, cesium-137 and total DDT concentrations allow for reliable dating of the sediment sections from 1940 to the present. Once the core sections have been dated, the chemical record of land-use activities in the watershed can be examined.
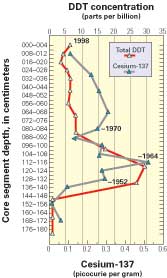
Figure 3. Total DDT and cesium-137 concentrations in bed sediment core segments from Sweetwater Reservoir. ~, approximately.
PAH compounds are another group of chemicals that are long-lived in the environment (National Research Council, 1983). They are produced during the combustion of organic substances such as coal, oil, gas, and garbage, and during brush and structure fires; they also are present in automobile and diesel exhaust, as well as in uncombusted petroleum products. PAHs are present in the air as gases and on particulate matter, as well as on street dust. Although they are not very soluble in water, they can accumulate in fish and other wildlife that live in and around the reservoir. PAHs are ubiquitous in the environment and are good indicators of urban development. Figure 4 shows a steady increase in PAH concentration over the past 70 years coincident with increasing urbanization over time.
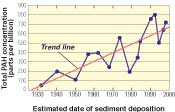
Figure 4. Total PAH concentrations in bed sediment core segments from Sweetwater Reservoir.
The water in Sweetwater Reservoir also comes from a variety of sources including direct rainfall, local runoff, and imported water. The chemical composition in the local runoff reflects the urban, industrial, rural, and natural land-use activities in the watershed (Lopes and Dionne, 1998). The water is sampled on a regular basis at various locations within Sweetwater and Loveland Reservoirs. These samples are analyzed for various pesticides and VOCs used today. Two herbicides--simazine and prometon--are frequently detected at both reservoirs. The insecticide diazinon is also routinely detected, but only at Sweetwater. These pesticides are used for agricultural and urban purposes. Figure 5 shows that the concentrations in water for these pesticides are extremely low, with average concentrations--0.015 parts per billion (ppb) simazine, 0.006 ppb prometon, and 0.007 ppb diazinon--many times lower than maximum contaminant levels and health advisories set by State and Federal governments (Majewski and Capel, 1995). Sources for these pesticides include runoff from agriculture use, maintenance of roadways and other rights-of-way, home and garden use, and atmospheric drift during and after any application.
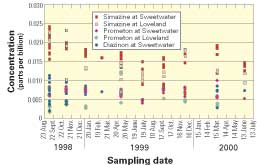
Figure 5. Water concentrations of the herbicides simazine and prometon and the insecticide diazinon in the Sweetwater and Loveland Reservoirs.
VOCs also are routinely detected in the water at both reservoirs. Sources of these compounds include industrial solvents, refrigerants, aerosol propellants, petroleum production, dry cleaning operations, plastic foam production, and vehicle emissions. Common household products that contain VOCs include pesticides, painting supplies, solvents, adhesives, cleaners and waxes, moth crystals, air fresheners, fabric protectors, chlorine bleach, and tobacco smoke. The gasoline additive methyl tert-butyl ether (MTBE) is classified as a VOC and is routinely detected in both reservoirs at an average concentration of about 0.16 ppb (fig. 6). MTBE has been detected in almost every reservoir in California (California Department of Health Services, accessed February 12, 2001). Table 1 shows that the MTBE concentrations found in Sweetwater and Loveland Reservoirs are many times lower than the concentrations found in other southern California reservoirs. When water from other reservoirs is transferred into Sweetwater Reservoir, however, the chemical contaminants also are transferred.
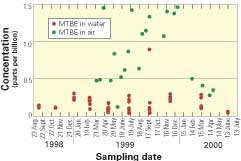
Figure 6. MTBE water concentrations at Sweetwater and Loveland Reservoirs, and MTBE air concentrations at Sweetwater Reservoir.
Table 1. MTBE concentrations in select southern California reservoirs
[Current California Primary Standard for drinking water is
13 ppb (parts per billion)]
In other state reservoirs, MTBE water concentrations are generally associated with gasoline-powered water craft (Dale and others, 2000). Because there is no public boating in the Sweetwater and Loveland Reservoirs, the most likely sources of MTBE are from runoff and atmospheric deposition. The average concentrations of MTBE and the other VOCs detected at both reservoirs are hundreds of times lower than the California primary and secondary drinking water standards of 13 and 5 ppb, respectively (California Code of Regulations, 1998). The water quality in Sweetwater Reservoir is very good with respect to the monitored chemical contaminants, which are expected to increase because the dominant source of these chemicals is urban activities.
Many chemicals become airborne during their manufacture or use and can be present in gaseous and particle form. The atmosphere plays an important role in moving these airborne chemicals from their point of origin and depositing them into areas where their presence was never intended. Dry deposition of airborne gases and particulate matter is generally a continual and slow process. Precipitation cleans the atmosphere of airborne pollutants and rinses the land surface of the accumulated dry deposition (Majewski and Capel, 1995). The resulting runoff, including everything it has collected from the atmosphere and the land surfaces, replenishes the drinking-water reservoirs. It is critical in any assessment of watershed health to monitor the atmosphere for the type, variety, and concentration of contaminants that are deposited and to assess what impact these chemicals have on the overall health of the watershed and its water quality.
The Sweetwater monitoring program includes an atmospheric monitoring station near the Sweetwater Reservoir. The air sampling data collected at this station establish detection frequency, temporal patterns, and ambient levels of selected airborne VOCs, PAHs, and pesticides in the gaseous or particle phases. This site was installed downwind of the proposed SR-125 route and upwind of Sweetwater Reservoir along a transect of the predominant wind direction. The station is currently monitoring for effects from the construction of the SR-54/SR-125 junction and will continue operating during the construction and operation of the SR-125 alignment. The site includes a fully instrumented meteorological station (fig 7) that records hourly averages of wind speed and direction, ambient air temperature and relative humidity at two heights, rainfall, barometric pressure, and atmospheric stability.
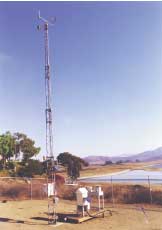
Figure 7. Air monitoring station at Sweetwater Reservoir.
Figure 6 shows the air concentrations of MTBE at Sweetwater Reservoir. Concentrations for MTBE range from 0.124 to 2.43 ppb with a median concentration of 1.11 ppb. These values are consistent with those the California Air Resources Board has measured in Chula Vista (median of 1.5 ppb in 1999) (California Air Resources Board, accessed Feb. 13, 2001).
Sweetwater Authority is concerned with the quality of water it provides to its customers. Results from the water-quality monitoring study that the USGS is conducting in the Sweetwater watershed show that the contaminant concentrations in bed sediments, water, and air are reflected in increased urbanization. The bed sediments show the most dramatic evidence of this impact with a sharp increase of persistent organic chemical concentrations over the past 65 years. Water quality is also affected by urbanization in the form of chemicals in the runoff water and deposition of airborne chemicals. The concentrations of the detected organic chemicals in Sweetwater and Loveland Reservoirs are all well below the guidance limits set by State and Federal agencies to protect human health. Many of these compounds are detected only because of the sensitive analytical methods used.
This monitoring program provides the Sweetwater Authority with information on what monitored chemicals are present in the reservoirs, and at what concentrations. With this information, the Authority can assess the associated risks, and consider future water treatment and remediation. These results also help focus and support future efforts by Sweetwater Authority to protect the watershed.
California Air Resources Board, Annual toxics summary, accessed Feb. 13, 2001, at URL <http://www.arb.ca.gov/aqd/toxics/ sitepages/mtbechul.html>
California Code of Regulations, 1998, Title 22, Division 4, Chapter 15, Article 4, Sections 64444 and 64449.
California Department of Health Services, MTBE in drinking water; surface water sources, accessed Feb. 12, 2001, at URL <http://www.dhs.cahwnet.gov/ps/ddwem/chemicals/mtbe/surfacewater.htm>
Caltrans, 1996, Fact Sheet--State Route 125 (From I-905 to State Route 54): California Department of Transportation, District 11, Sacramento, Calif.
Charles, M.J., and Hites, R.A., 1987, Sediments as archives of environmental pollution trends, in Hites, R.A., and Eisenreich, S.J., eds., Advances in chemistry series 216: Sources and fates of aquatic pollutants: Washington, D.C., American Chemical Society, 558 p.
Dale, M.S., Koch, B., Losee, R.F., Crofts, E.W., and Davis, M.K., 2000, MTBE in southern California water: Journal of the American Water Works Association, v. 92, no. 8, p. 42-51.
Gilliom, R.J., Alley, W.M., and Gurtz, M.E., 1995, Design of the National Water-Quality Assessment Program: Occurrence and distribution of water-quality conditions: U.S. Geological Survey Circular 1112, 33 p.
Lopes, T.J., and Dionne, S.G., 1998, A review of semivolatile and volatile organic compounds in highway runoff and urban stormwater: U.S. Geological Survey Open-File Report 98-409, 64 p.
Majewski, M.S., and Capel, P.D., 1995, Pesticides in the atmosphere--Distribution, trends, and governing factors: Chelsea, Mich., Ann Arbor Press, Pesticides in the Hydrologic System series, v. 1, 214 p. [available from CRC Press].
National Research Council, 1983, Polycyclic aromatic hydrocarbons--Evaluation of sources and effects: Washington, D.C., National Academy Press, 476 p.
Pennington, M., Cambray, R.S., and Fisher, E.M., 1973, Observations on lake sediments using fallout 137Cs as a tracer: Nature, v. 242, p. 324-326.
| AccessibilityFOIAPrivacyPolicies and Notices | |
 |
|