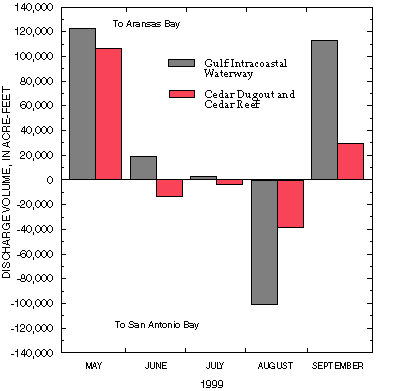
Figure 3. Net monthly discharge volumes for two stations between San Antonio Bay and Aransas Bay, May–September 1999. Positive indicates direction is from San Antonio Bay toward Aransas Bay; negative indicates reverse direction.
Back to Text | Contents | Figure 4