Figure 3. Graph of concentrations of chlordane in sediment cores CCA and CCD (green symbols) and in blue crabs and bottom-feeding fish (red symbols). Data on blue crabs and fish collected in 1993 (Williams, 1993) and 2000 (Texas Department of Health, 2002). Results shown are 1993 median of six blue crab and 15 bottom-feeding fish (carp, smallmouth buffalo, and catfish) and 2000 median of four blue crab and 12 bottom-feeding fish. Low chlordane concentrations in upper part of cores indicate current loading of this pesticide in Clear Creek, whereas nondetections in lower part of cores indicate no historical trend.

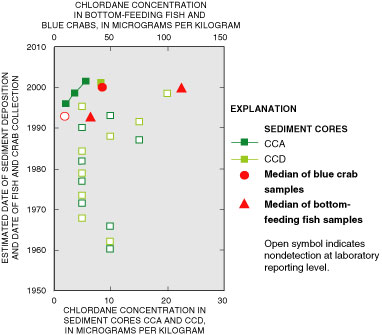
Figure 3.  Concentrations of chlordane in sediment cores CCA and CCD (green symbols) and in blue crabs and bottom-feeding fish (red symbols). Data on blue crabs and fish collected in 1993 (Williams, 1993) and 2000 (Texas Department of Health, 2002). Results shown are 1993 median of six blue crab and 15 bottom-feeding fish (carp, smallmouth buffalo, and catfish) and 2000 median of four blue crab and 12 bottom-feeding fish. Low chlordane concentrations in upper part of cores indicate current loading of this pesticide in Clear Creek, whereas nondetections in lower part of cores indicate no historical trend.

Back to Text | Contents