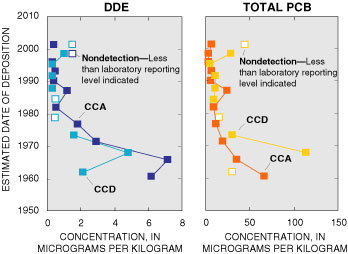
Figure 4. DDE, a breakdown product of DDT, and total PCB show pronounced historical trends, with peaks in sediment cores CCA and CCD coinciding with the period of peak use.
Back to Text | Contents