Graphs showing the difference between concentrations of DDE and total PAH in suspended sediments discharging from the springs of the Barton Springs system (yellow background) and in runoff in nearby creeks (blue background) . Relative magnitude of concentrations was compared to sediment-quality guidelines (MacDonald and others, 2000), as indicated by symbol color.

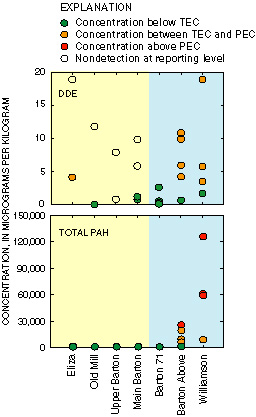
Figure 3. The difference between concentrations of DDE and total PAH in suspended sediments discharging from the springs of the Barton Springs system (yellow background) and in runoff in nearby creeks (blue background) is shown. Relative magnitude of concentrations was compared to sediment-quality guidelines (MacDonald and others, 2000), as indicated by symbol color.

Contents | Back to Text | Figure 4