Graphs showing correlation of concentrations of different metals to concentration of iron in suspended sediments indicates which samples might have an anthropogenic contribution. A linear relation between iron and the other metals is shown by a dashed line. For most metals, spring and surface-water sediments plot on that line, indicating that the concentration of the individual metals is proportional to that of iron, and thus probably reflects the natural geochemistry of the sediments. A few outliers plot above the line, suggesting an additional, anthropogenic source of the metal for those samples. In contrast, for lead and zinc, two metals with a strong urban source signal, most samples from the two urbanized surface-water sites (Barton Above and Williamson) plot in a cluster above the line, as indicated by the dashed ovals, while suspended sediments from the springs and Barton 71 plot on the line.

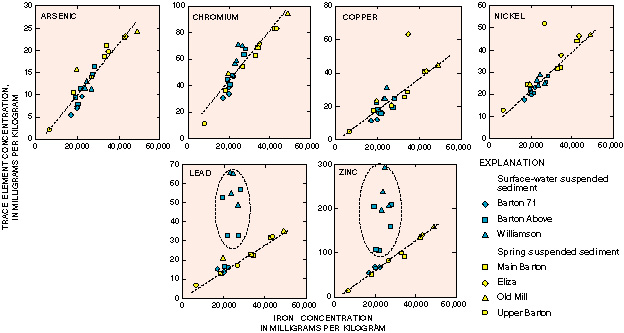
Figure 5. Correlation of concentrations of different metals to concentration of iron in suspended sediments indicates which samples might have an anthropogenic contribution. A linear relation between iron and the other metals is shown by a dashed line. For most metals, spring and surface-water sediments plot on that line, indicating that the concentration of the individual metals is proportional to that of iron, and thus probably reflects the natural geochemistry of the sediments. A few outliers plot above the line, suggesting an additional, anthropogenic source of the metal for those samples. In contrast, for lead and zinc, two metals with a strong urban source signal, most samples from the two urbanized surface-water sites (Barton Above and Williamson) plot in a cluster above the line, as indicated by the dashed ovals, while suspended sediments from the springs and Barton 71 plot on the line.

Contents | Back to Text