This report is available in pdf 504KB.
Estimates of the magnitude and frequency of flood-peak discharges and flood hydrographs are used for a variety of purposes, such as for the design of bridges, culverts, and flood-control structures; and for the management and regulation of flood plains. To provide simple methods of estimating flood-peak discharges, the US Geological Survey (USGS) has developed and published regression equations for every State, the Commonwealth of Puerto Rico, American Samoa, and a number of metropolitan areas in the United States. In 1993, the USGS, in cooperation with the Federal Emergency Management Agency and the Federal Highway Administration, compiled all current USGS statewide and metropolitan area regression equations into a computer program titled “The National Flood-Frequency (NFF) Program” (Jennings and others, 1994).
Since 1993, new or updated regression equations have been developed by the USGS for various areas of the Nation. These new equations have been incorporated into an updated version of the NFF Program.
This fact sheet describes the application of the updated NFF Program to streams that drain rural areas in Maryland. Information on obtaining the NFF software and fact sheets for other areas of the Nation is provided at the end of this Fact Sheet.
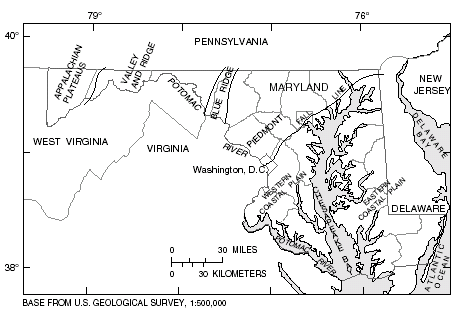
Dillow (1996) developed regression equations for estimating peak discharges (QT), in cubic feet per second, that have recurrence intervals (T) that range from 2 to 500 years for unregulated, rural, non-tidal Maryland streams. Separate equations were developed for each of the five physiographic provinces in Maryland: Appalachian Plateaus, Blue Ridge and Valley and Ridge, Piedmont, Western Coastal Plain, and Eastern Coastal Plain (fig. 1). Analysis of regression residuals was used to confirm the validity of subdividing the State on the basis of physiographic provinces.
|
| Figure 1. Study area and physiographic provinces in Maryland. |
The regression equations were developed using peak-discharge data through September 30, 1990, from streamflowgaging stations at 107 locations in Maryland and 112 locations in Delaware, Pennsylvania, Virginia, and West Virginia. Dillow (1996) presented the peak-flow data and explanatory watershed variables for the 219 streamflow-gaging stations used to develop the regression equations.
The equations are based on the inch- pound system of units, but the NFF Program will accept and report either the inch-pound or the metric system of units. The explanatory watershed variables used in the regression equations are as follow:
Drainage area (A), in square miles, is the total area that contributes runoff upstream of the stream site of interest determined by planimeter from the best available topographic maps.
Storage (ST) is the percentage of drainage area, A, that is covered by lakes and ponds determined by planimeter from USGS topographic maps of areas of blue overprint. The constant of 10 is added to ST by the NFF Program; the user enters the actual value of ST.
Limestone geology (LI) is the percentage of drainage area, A, that is underlain by limestone or dolomite determined by planimeter from geologic maps by Edwards (1978) and Berg (1980). The constant 10 is added to LI by the NFF Program; the user enters the actual value of LI.
Runoff-curve number (RCN) represents the effect of hydrologic soil type and land use (U.S. Department of Agriculture, 1985). Hydrologic soil type coverage can be determined from Maryland Department of State Planning (1973) natural soil groups maps. When more than one hydrologic soil type or land use is present in a basin, a weighted RCN should be determined based on the percentage of drainage each hydrologic soil-type/land-use combination contributes to the entire drainage area. The constant 33 is subtracted from RCN by the NFF Program; the user enters the actual value of RCN.
|
Table 1. Runoff-curve numbers defined by land use and hydrologic soil type in Maryland (from Dillow, 1996) [Hydrologic soil types: A, soil with low runoff potential; B, soil with moderately low runoff potential; C, soil with moderately high runoff potential; and D, soil with high runoff potential; DU/AC, dwelling units per acre; >, greater than] |
||||
|
|
||||
| Land-use category | ||||
|---|---|---|---|---|
| Hydrologic soil type | A | B | C | D |
|
|
||||
| Residential (0.2 to 2 DU/AC) | 54 | 70 | 80 | 85 |
| Residential (>2 to 8 DU/AC) | 61 | 75 | 83 | 87 |
| Residential (>8 DU/AC) | 77 | 85 | 90 | 92 |
| Commercial/Industrial | 89 | 92 | 94 | 95 |
| Institutional | 81 | 88 | 91 | 93 |
| Forest | 36 | 60 | 73 | 9 |
| Brush | 35 | 56 | 70 | 77 |
| Water | 100 | 100 | 100 | 100 |
| Wetlands | 100 | 100 | 100 | 100 |
| Beach/barren/extractive | 77 | 86 | 91 | 94 |
| Cropland | 72 | 81 | 88 | 91 |
| Grass | 49 | 69 | 79 | 84 |
|
|
||||
Area of forest (F) is the percentage of drainage area, A, that is covered by forests determined by planimeter from USGS topographic maps of areas of green overprint. The constant 10 is added to F by the NFF Program; the user enters the actual value of F.
Basin relief (BR), in feet (National Geodetic Vertical Datum of 1929), is the difference in elevation between the mean basin elevation, as determined from topographic maps by the grid-sampling method, and the basin outlet.
The regression equations, the average standard errors of prediction, and the equivalent years of record are shown in table 2. The average standard error of prediction is a measure of the accuracy of a regression equation when used to estimate peak discharges for ungaged watersheds similar to those used to derive the regression equation. Errors in the QT estimates for about two-thirds of the ungaged sites will be within the given standard errors. Errors increase appreciably when any of the basin characteristics used in the equations are near or beyond the range limits shown in table 3. The equivalent years of record is the number of years of stream-flow record needed to achieve the same accuracy as the regression equation.
|
Table 2. Flood-peak discharge regression equations and associated statistics for streams that drain rural areas in Maryland (modified from Dillow, 1996) [QT, peak discharge for recurrence interval T, 2 to 500 years, in cubic meters per second; A, drainage area, in square miles; F, forest cover, in percent; BR, basin relief, in feet; LI, limestone geology (limestone, dolomite), in percent; RCN, runoff-curve number; ST, storage (lakes, ponds, and swamps), in percent] |
||
|
|
||
|---|---|---|
| Regression Equations |
Average standard error of prediction, in percent |
Equivalent years of record |
|
|
||
| Appalachian Plateaus Province (46 gaging stations) | ||
| Q2 = 106A0.851(F+10)-0.223BR0.056 | 24 | 5 |
| Q5 = 109A0.858(F+10)-0.143BR0.064 | 22 | 10 |
| Q10 = 113A0.859(F+10)-0.106BR0.072 | 21 | 14 |
| Q25 = 118A0.858(F+10)-0.072BR0.087 | 23 | 18 |
| Q50 = 121A0.858(F+10)-0.051BR0.099 | 25 | 20 |
| Q100 = 124A0.858(F+10)-0.033BR0.111 | 28 | 20 |
| Q500 = 127A0.859(F+10)0.004BR0.140 | 35 | 19 |
| Blue Ridge and Valley and Ridge Province (34 gaging stations) | ||
| Q2 = 4,260A0.774(LI+10)-0.549BR-0.405 | 50 | 2 |
| Q5 = 6,670A0.752(LI+10)-0.564BR-0.354 | 45 | 4 |
| Q10 = 8,740A0.741(LI+10)-0.579BR-0.326 | 42 | 7 |
| Q25 = 12,000A0.730(LI+10)-0.602BR-0.295 | 41 | 12 |
| Q50 = 15,100A0.723(LI+10)-0.620BR-0.276 | 40 | 15 |
| Q100 = 18,900A0.719(LI+10)-0.639BR-0.261 | 41 | 18 |
| Q500 = 31,800A0.712(LI+10)-0.686BR-0.241 | 45 | 23 |
| Piedmont Province (81 gaging stations) | ||
| Q2 = 451A0.635(F+10)-0.266 | 39 | 3 |
| Q5 = 839A0.606(F+10)-0.248 | 36 | 7 |
| Q10 = 1,210A0.589(F+10)-0.242 | 35 | 10 |
| Q25 = 1,820A0.574(F+10)-0.239 | 37 | 15 |
| Q50 = 2,390A0.565(F+10)-0.240 | 40 | 17 |
| Q100 = 3,060A0.557(F+10)-0.241 | 43 | 19 |
| Q500 = 5,190A0.543(F+10)-0.245 | 52 | 20 |
| Western Coastal Plain Province (21 gaging stations) | ||
| Q2 = 1,4100.761(F+10)-0.782 | 55 | 2 |
| Q5 = 1,780A0.769(F+10)-0.687 | 51 | 4 |
| Q10 = 1,910A0.771(F+10)-0.613 | 51 | 7 |
| Q25 = 2,000A0.772(F+10)-0.519 | 54 | 10 |
| Q50 = 2,060A0.771(F+10)-0.452 | 58 | 12 |
| Q100 = 2,140A0.770(F+10)-0.391 | 63 | 13 |
| Q500 = 2,380A0.765(F+10)-0.263 | 77 | 14 |
| Eastern Coastal Plain Province (37 gaging stations) | ||
| Q2 = 0.25A0.591(RCN-33)1.70BR0.310(F+10)-0.464(ST+10)-0.148 | 46 | 2 |
| Q5 = 1.05A0.595(RCN-33)1.74BR0.404(F+10)-0.586(ST+10)-0.498 | 46 | 5 |
| Q10 = 3.24A0.597(RCN-33)1.71BR0.436(F+10)-0.667(ST+10)-0.694 | 45 | 7 |
| Q25 = 13.1A0.597(RCN-33)1.66BR0.457(F+10)-0.770(ST+10)-0.892 | 45 | 12 |
| Q50 = 35.0A0.594(RCN-33)1.62BR0.465(F+10)-0.847(ST+10)-1.01 | 45 | 16 |
| Q100 = 87.6A0.589(RCN-33)1.58BR0.470(F+10)-0.923(ST+10)-1.11 | 46 | 19 |
| Q500 = 627A0.573(RCN-33)1.49BR0.478(F+10)-1.10(ST+10)-1.29 | 48 | 28 |
|
|
||
| Table 3. Range of explanatory variables
for which regression equations are applicable for streams that drain rural
areas in Maryland (from Dillow, 1996) [--, data either not applicable or not significant] |
||||||
|
|
||||||
| Physiographic province | Drainage area, in square miles |
Carbonate rock coverage, in percent |
Storage, in percent |
Basin relief, in feet |
Forest cover, in percent |
Runoff-curve number |
|---|---|---|---|---|---|---|
|
|
||||||
| Appalachian Plateaus | 0.22–247 | -- | -- | 88–1,431 | 28–96 | -- |
| Blue Ridge and Valley and Ridge | .10–494 | 0–100 | -- | 18–745 | -- | -- |
| Piedmont | .26–165 | -- | -- | -- | 0–96 | -- |
| Western Coastal Plain | .30–54.8 | -- | -- | -- | 19–83 | -- |
|
|
||||||
Dillow (1996) developed weighting techniques to improve estimates of peak discharge at gaged locations by combining the estimates derived from analysis of gage records with estimates derived from the regression equations. The weights of these two independent estimates are based on the length of the gage record (in years) and the equivalent years of record of the applicable regression equation. The weighted estimate of peak discharge is computed as
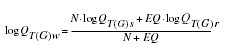
where
|
QT(G)w
|
is the weighted estimate of discharge Q for recurrence interval T at the gage location, |
|
QT(G)s
|
is the estimate of QT derived from analysis of the systematic gage records, |
|
QT(G)r
|
is the estimate of QT
derived from application of the appropriate regression equation in table 2, |
|
N
|
is the number of years in the
gage record used to compute QT(G)s, and |
|
EQ
|
is the equivalent years of record (table 2). |
The accuracy of the weighted discharge estimate, in equivalent years of record, is equal to N + EQ. The NFF Program performs these computations.
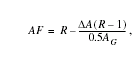
Dillow (1996) showed how the weighted estimate of peak discharge for a gaged site can be used to improve estimates of peak discharge for an ungaged site on the same stream with a drainage area that is between 50 and 150 percent of the drainage area for the gaged site. The regression estimate for the ungaged site is multiplied by an adjustment factor, which is computed as
where
|
AF
|
is the adjustment factor, |
|
|
is the absolute value of the difference in drainage area between the gaged site (AG) and the ungaged site (AU), |AG-AU|, and |
|
R
|
is the ratio of the weighted
peak-discharge estimate at the gaged site to the regression estimate at
the ungaged site, QT(G)w/QT(G)r). |
The equations are used without adjustment where the drainage area of the ungaged site is not within 50 to 150 percent the drainage area of the gaged site.
When the drainage area of the site of interest is in more than one physiographic province, a weighted estimate of the peak discharge should be computed. The equations for the appropriate regions should be applied independently using basinwide estimates of the required explanatory variable. The weighted estimate is then computed by multiplying each regional estimate against the fraction of the drainage area in that region and summing the products. The NFF Program performs this computation.
—Prepared by Robert R. Mason, Jr. and Luis A. Fuste of the U.S. Geological Survey; and Jeffrey N. King and Wilbert O. Thomas, Jr., of Michael Baker, Jr., Inc.
Berg, T.M., comp., 1980, Geologic map of Pennsylvania: Pennsylvania Topographic and Geologic Survey, 4th Series, 1 map on 2 sheets, scale 1:250,000 plus 1 sheet of cross sections.
Dillow, J.J.A., 1996, Technique for estimating magnitude and frequency of peak flows in Maryland: U.S. Geological Survey Water-Resources Investigations Report 95–4154, 55 p.
Edwards, J.E., Jr., comp., 1978, Geologic map of Washington County: Maryland Geological Survey, 1 sheet, scale 1:62,500.
Jennings, M.E., Thomas, W.O., Jr., and Riggs, H.C., comps., 1994, Nationwide summary of U.S. Geological Survey regional regression equations for estimating magnitude and frequency of floods for ungaged sites, 1993: U.S. Geological Survey Water-Resources Investigations Report 94–4002, 196 p.
Maryland Department of State Planning, 1973, Natural soil groups report: Maryland Department of State Planning Report No. 199, 153 p.
U.S. Department of Agriculture, 1985, Soil Conservation Service National Engineering Handbook, Section 4, Hydrology.
For more information contact:
U.S. Geological Survey
Office of Surface Water
415 National Center
Reston, Virginia 20192
(703) 648-5301
USGS hydrologic analysis software is available for electronic retrieval through
the World Wide Web (WWW) at :
http://water.usgs.gov/software/
and through anonymous File Transfer Protocol (FTP) from water.usgs.gov (directory:
/pub/software).
The WWW page and FTP directory from which the National Flood-Frequency software
and user documentation can be retrieved are http://water.usgs.gov/software/nff.html
and /pub/software/surface_water/nff,
respectively.
Additional earth science information is available from the USGS through the
WWW at http://www.usgs.gov/ or
by calling 1-888-ASK-USGS.
| AccessibilityFOIAPrivacyPolicies and Notices | |
 |
|