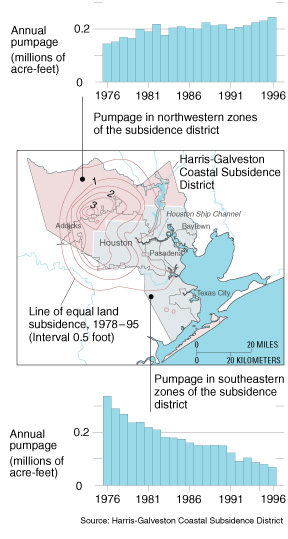
Figure 3. During 197895, subsidence in areas southeast of Houston essentially ceased as pumpage there decreased; and subsidence continued in areas northwest as pumpage there increased.
Back | Figure 4