
| Sweetwater Reservoir in San Diego County contains natural organic carbon that has a high potential to form hazardous disinfection byproducts during the drinking water-treatment process. The U.S. Geological Survey and the Sweetwater Authority, the managers of Sweetwater Reservoir, are investigating the sources of natural organic carbon to the reservoir and ways to mitigate potential disinfection byproduct problems. Research results suggest that relatively simple changes in reservoir- management and water-treatment strategies may reduce natural organic carbon concentrations, thereby reducing by 30 percent the formation of a major type of disinfection byproduct, trihalomethanes (THMs). |
Drinking water can be adversely affected by certain types of natural organic material present in the source water. Sweetwater Reservoir is the water source for the Sweetwater Authority’s Perdue Water Treatment Plant, which provides drinking water to Chula Vista and National City, California (figs. 1 and 2). Chlorine, which must be added as a disinfectant during the drinking water treatment process, reacts with certain types of natural organic material and naturally occurring bromide to produce undesirable disinfection byproducts, including trihalomethanes (THMs; figs. 3 and 4). THMs, which present a human health hazard, are stringently regulated by the U.S. Environmental Protection Agency (EPA). Therefore, the Sweetwater Authority desires information about the sources of THM-forming organic carbon and possible means to lower the concentration of such material in Sweetwater Reservoir. The U.S. Geological Survey and the Sweetwater Authority are cooperatively studying possible watershed management strategies to reduce the concentration of THM-forming carbon in Sweetwater Reservoir, and thus, improve drinking-water quality.
 |
| Figure 1. Locations of Sweetwater and Loveland Reservoirs and Sweetwater River. |
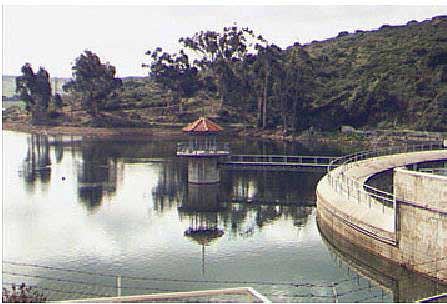 |
| Figure 2. Sweetwater Reservoir, dam, and intake tower for the Sweetwater Authority’s Perdue Water Treatment Plant. |
 |
| Figure 3. Four potential sources of trihalomethane (THM)-forming natural organic carbon to Sweetwater Reservoir |
 |
| Figure 4. Reaction of natural organic carbon and bromide with chlorine added during water-treatment forms trihalomethanes (THMs). |
The majority of natural organic carbon in the water is present as dissolved organic carbon (DOC), with the remainder as particulate organic carbon (POC), each with multiple sources in the watershed. POC and DOC may react with chlorine to form THMs. This study is examining four potential sources of THM-forming natural organic carbon to Sweetwater Reservoir: 1) particles in the water, 2) flooding of vegetation on the reservoir margins, 3) the annual transfer of water from an upstream reservoir, and 4) nearby wetlands (fig. 3). No imported water was added to the reservoir during the study. The reservoir water contains particles, including algae, that contain natural organic carbon. Vegetation on the reservoir margins is flooded due to fluctuation in the reservoir water level. During the year, as water is withdrawn from the reservoir for use, the water level gradually drops 4-5 meters (m) [13-17 feet (ft)], exposing almost one-half of the reservoir bottom as dry land; vegetation grows in these areas. The reservoir is filled once a year during the wet season by a transfer of water from Loveland Reservoir, 27 kilometers (km) [17 miles (mi)] upstream on the Sweetwater River (fig. 1). Flooding of the vegetation may release natural organic carbon into the water, similar to steeping of tea leaves in water to produce tea. Also, natural organic carbon may be swept out of the river channel during the water transfer or released from wetlands along the Sweetwater River into the reservoir. Wetlands along the river are important habitat, and the Sweetwater Authority maintains wetlands just east of Sweetwater Reservoir for the least Bells’ vireo (Vireo bellii pusillus), an endangered bird.
The concentration of DOC in Sweetwater Reservoir varies on an annual cycle from about 6 milligrams per liter (mg/L) when the reservoir is filled, to about 8.5 mg/L when reservoir water levels drop (fig. 5). DOC concentration also varies with water depth, in part due to stratification of the water column. Only a small fraction of the DOC present reacts with chlorine to form THMs and other disinfection byproducts. The amount of this reactive fraction of DOC in the reservoir varies by a factor of almost two during the year (fig. 5), ranging from 400 parts per million (ppm) in the winter to about 750 ppm in the summer (a reactivity of 400 ppm means that 400 out of 1 million carbon atoms in the DOC will react to form THMs during 5 minutes of reaction between added chlorine and the DOC). The variation in reactivity is related to the sources of the organic carbon.
 |
| Figure 5. Dissolved organic carbon (DOC) concentration and reactivity of DOC to form trihalomethanes (THMs) in water samples from the intake tower in Sweetwater Reservoir for the Perdue Water Treatment Plant. Reactivity is defined as the number of carbon atoms that react to form THM per one million carbon atoms in a sample during five minutes of reaction with added chlorine. Reactivity of DOC to form THMs was measured using modified versions of EPA Methods 510.1 and 502.2. Water level at the gauge in the reservoir is also shown. |
In the Sweetwater Authority’s watertreatment process, water is chlorinated prior to filtration, and therefore particles containing natural organic carbon are present in the water (fig. 3). Common types of particles include algal and bacterial biomass, flocculated humic substances, and sediments. These particles may contribute substantially to the total amount of THMs formed.
In an experiment comparing chlorinated filtered and unfiltered water, unfiltered water formed more THMs than the corresponded filtered water sample (fig. 6), indicating that a significant amount of the THM-forming carbon in unfiltered water is derived from particles. For example, in samples collected from near the intakes to the treatment plant, unfiltered water formed 4 - 49 percent more of the THMs than filtered water (fig. 6); the additional THMs formed from natural organic carbon in the particles. Furthermore, because the greatest contribution from particles occurred during the summer and early fall, when algal populations were greatest, it is likely algae are the dominant particles containing THM-forming carbon.
 |
| Figure 6. Comparison of trihalomethane (THM) concentrations produced by chlorination of filtered and unfiltered aliquots of samples from Sweetwater and Loveland Reservoirs and the Sweetwater River. The heavy line labelled 1:1 shows where samples plot if unfiltered and filtered aliquots formed the same amount of THM. Lighter lines indicate where samples plot if the unfiltered aliquot forms 1.25, 1.5, and 2 times as much THM as the filtered aliquot. |
This comparison indicates that an average of 20 percent reduction in THM formation may be possible by filtering water prior to chlorination. This study did not determine the sources of all the particles containing the THM-forming natural organic carbon.
The maximum water level in Sweetwater Reservoir usually is reached in late winter, after the annual water transfer from Loveland Reservoir and the conclusion of the rainy season. The water level drops as water is withdrawn for use, and the minimum water level usually is reached in late fall. The receding water level exposes highly fertile sediments around the margins of the reservoir, particularly at the eastern end, which may comprise up to one-half of the maximum reservoir surface area (fig. 3). Vegetation quickly grows in these areas (fig. 7) and is dominated by volunteer stands of smartweed and grasses, which may be 2 m (6.5 ft) tall when the reservoir is filled the following year. Currently, the vegetation is mowed to prevent plant succession and infilling of the reservoir. As the water level rises and the margins of the reservoir are inundated, the newly flooded, mowed vegetation degrades and releases DOC into the water.
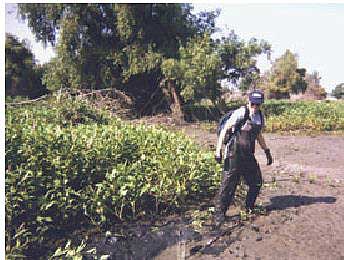 |
| Figure 7. Vegetation and organic-rich soils near Sweetwater Reservoir in July 1999. The vegetation was mowed in November 1999 after the soil dried, and the area was flooded by rising water during filling of the reservoir in February 2000. |
Water covering the newly flooded areas of the reservoir bottom has consistently higher DOC concentrations than water from areas of the reservoir that always were under water (fig. 8), implicating the mowed vegetation as the source of the higher DOC. Calculations indicate that 1 month after the annual water transfer filled the Reservoir, DOC from the degradation of the mowed vegetation constituted 6 percent of the DOC in the Reservoir as a whole. Furthermore, this DOC, which has a reactivity of 1,000- 2,000 ppm, has two to five times more capacity to form THM than does the average DOC in the reservoir (compare figs. 5 and 8). As a result, DOC from the degradation of the mowed vegetation in the first month after flooding may account for 10 percent of the THM-forming carbon in the reservoir.
 |
| Figure 8. Dissolved organic carbon (DOC) concentrations in water from Sweetwater Reservoir. Samples were collected during the first month following the annual water transfer that fills the Reservoir. Water depth refers to the total water depth at the sampling site, and samples collected from different levels in the water column at a site are plotted according to total water depth. Samples were collected from ten sampling sites in the reservoir. |
These results suggest that harvesting the vegetation and removing it from the reservoir margins prior to flooding could improve water quality by reducing THM formation 10 percent. This study did not assess the contribution from the organic-rich soils in the flooded areas.
Sweetwater Reservoir is filled annually in early winter with water released from Loveland Reservoir, which is 27 km (17 mi) upstream on the Sweetwater River (figs. 1 and 3). During the release, water flows in the Sweetwater River for 2 weeks; the riverbed is dry most of the rest of the year. The water in Loveland Reservoir is of higher quality than that in Sweetwater Reservoir because it contains lower concentrations of DOC and bromide (a naturally occurring salt ion). To determine the quantity of DOC and bromide added to the water as it flows from Loveland to Sweetwater Reservoir, samples were collected at sites along the Sweetwater River during the winter 2000 transfer and analyzed for DOC concentration, THM formation potential, and specific conductivity. For this study, specific conductivity was used as a surrogate measurement for bromide (a linear relation between specific conductivity and bromide was observed for a subset of water samples).
The results indicated that the leading edge of the transferred water as it entered Sweetwater Reservoir contained as much as five times higher DOC and bromide concentrations than the water in Loveland Reservoir. After several days of flow, these high concentrations decreased to levels close to those in Loveland Reservoir. Calculations of loads indicate that during the winter 2000 transfer, 60 percent more bromide and 11 percent more DOC were added to Sweetwater Reservoir than would be expected for a “clean” transfer of water from Loveland Reservoir. The additional DOC was from natural organic debris swept from the Sweetwater River channel, and the bromide was from ground water flushed out of the shallow aquifer beneath the channel.
These results suggest that it may be possible to prevent some of this THM-forming DOC and bromide from reaching Sweetwater Reservoir. Transferred water flowing into the Reservoir within the first 24 hours contains the highest concentrations of DOC and bromide, and this DOC has a larger reactive fraction than the average DOC in the reservoir (750-1,200 ppm compared with 400-750 ppm). At the expense of losing about 2 percent of the transferred water, diverting water into the existing urban runoff diversion system around Sweetwater Reservoir during the first 24 hours of transfer would reduce the THM formation potential of the entire reservoir by about 2 percent.
The eastern end of Sweetwater Reservoir contains cottonwood-willow wetland, open pond, and marsh areas maintained by the Sweetwater Authority for wildlife habitat, particularly for the least Bells’ vireo, an endangered species (figs. 1 and 3). In many systems, wetland habitats can be important contributors to THM formation because they produce large concentrations of DOC with a high capacity to form THM. However, this study suggests that the wetland habitats currently are not a major source of DOC to Sweetwater Reservoir. During the annual water transfer from Loveland Reservoir, DOC concentrations upstream and downstream of the habitat area were not appreciably different, as they would have been if significant amounts of DOC were added during flow through the wetlands. The extent of the wetlands habitat is only 6 percent of the river length between the two reservoirs. Although the wetlands ponds contain high concentrations of DOC with a large reactive fraction, there is negligible overland water flow from the wetlands into Sweetwater Reservoir during most of the year, and thus, minimal wetland DOC seems to enter the reservoir.
The Sweetwater Authority has undertaken a cooperative study with the U.S. Geological Study to evaluate watershed improvements that would support its commitment to providing high-quality drinking water to the residents of Chula Vista and National City, California. This study provides information about the sources and processes contributing natural organic carbon and bromide to Sweetwater Reservoir, which can react with chlorine during water treatment to produce undesirable disinfection byproducts, such as trihalomethanes (THMs). The main results of this study are:
Three strategies could reduce the average THM formation potential in Sweetwater Reservoir water by about 30 percent (fig 9):
 |
| Figure 9. Relative importance of and possible mitigation strategies for the four potential sources of trihalomethane (THM)- forming organic carbon to Sweetwater Reservoir. Red type indicates the relative importance of each source and green type indicates a potential mitigation strategy. Reducing the input of THMforming natural organic carbon and bromide from these sources could result in a 30 percent decrease in the amount of THM formed during the drinking water treatment process. |
Wetlands maintained for species habitat at the eastern end of Sweetwater Reservoir currently are not a major source THM-forming carbon to the reservoir.
Miranda S. Fram, Brian A. Bergamaschi, and Roger Fujii
|
COOPERATING ORGANIZATION |
 |
FOR MORE INFORMATION CONTACT THE AUTHORS:
Miranda S. Fram (mfram@usgs.gov)
Brian A. Bergamaschi (bbergama@usgs.gov)
Roger Fujii (rfujji@usgs.gov)
U.S. Geological Survey
6000 J Street, Placer Hall
Sacramento, CA 95819-6129
phone number: 916-278-3000
http://ca.water.usgs.gov