

Fact Sheet 116—03
February 2004
1 U.S. Geological Survey, Water Resources Discipline, Wisconsin District Office
2 Wisconsin Geological and Natural History Survey, University of Wisconsin—Extension
Study Area and Modeling Objectives
Model Construction and Calibration
Water Levels from Observation Wells
Streamflow Measurements at Gaging Stations
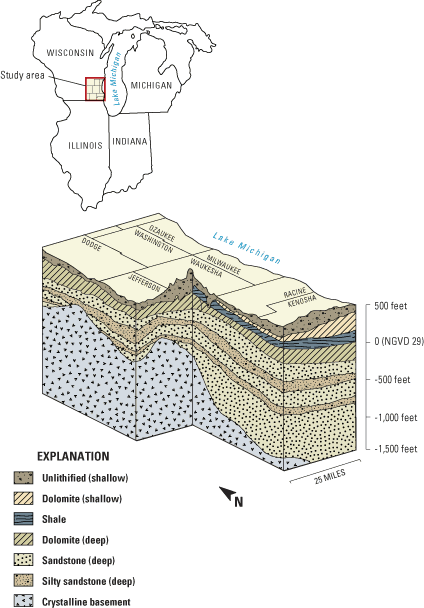
Figure 1. Block diagram of hydrogeologic framework in southeastern Wiscons...
Figure 2. Observation well network, southeastern Wisconsin. Data for each w...
Figure 3. Observed and simulated water levels in deep observation wells tha...
Figure 4. U.S. Geological Survey streamgaging network, southeastern Wiscons...
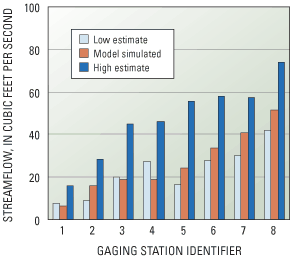
Figure 5. Comparison of model-simulated baseflow to estimated baseflow at s...
Figure 6. Shallow and deep pumping rates by county, southeastern Wisconsin,...
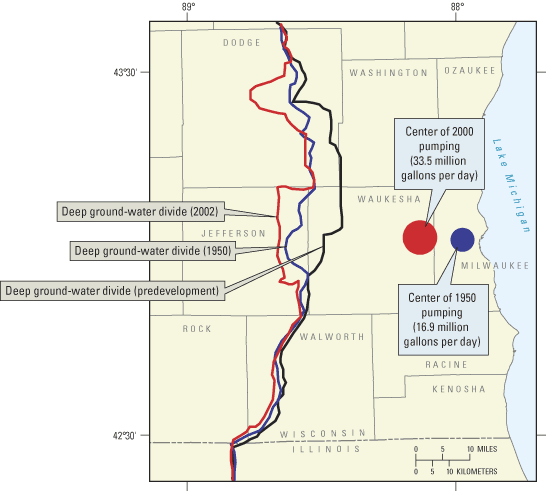
Figure 7. Effect of shifting the pumping center on deep ground-water flow, ...
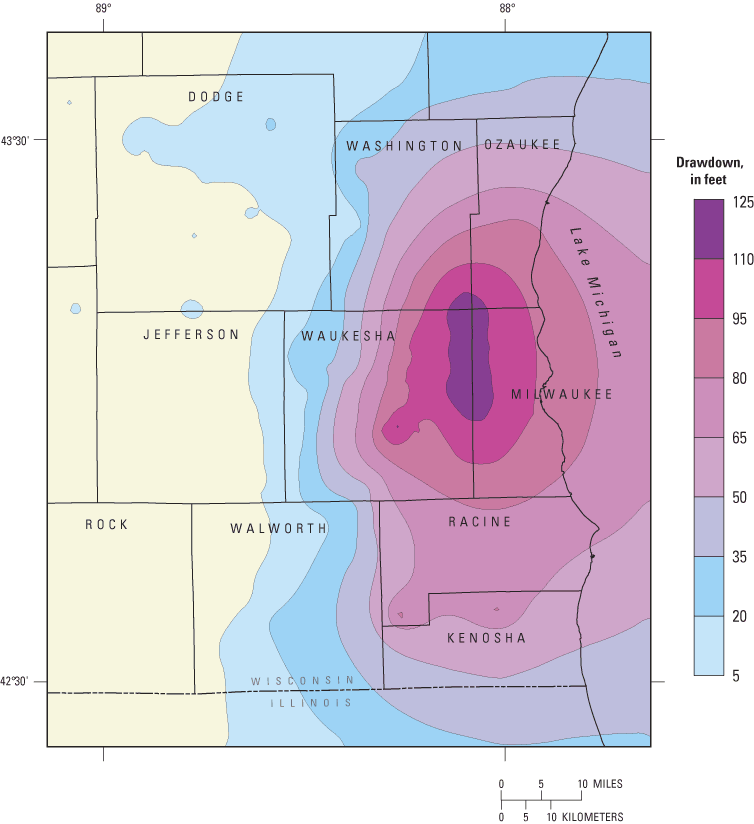
Figure 8. Simulated drawdown in deep part of flow system in southeastern Wi...
As environmental issues have come to the forefront of public concern, so has the awareness of the importance of ground water in the overall water cycle and as a source of the Nation's drinking water. Heightened interest has spawned a host of scientific enterprises (Taylor and Alley, 2001). Some activities are directed toward collection of water-level data and related information to monitor the physical and chemical state of the resource. Other activities are directed at interpretive studies undertaken, for example, to optimize the location of new water-supply wells or to protect rivers and lakes fed by ground water. An important type of interpretive study is the computer ground-water-flow model that integrates field data in a mathematical framework. Long-term, systematic collection of hydrologic data is crucial to the construction and testing of ground-water models so that they can reproduce the evolution of flow systems and forecast future conditions.
This Fact Sheet provides an example of the incorporation of historical hydrologic data in a regional ground-water model for southeastern Wisconsin. The example demonstrates how the collection of three categories of long-term records—water levels from observation wells, streamflow measurements at gaging stations, and water-use records from high-capacity wells—allows the model to reproduce past conditions and simulate future trends. It is the availability of these long-term data, dating back to measurements from the earliest water-supply wells in the 19th century, that couple the computer model to real-world conditions, and, thus, give it value as a scientific and water-resources management tool.
The model discussed in this Fact Sheet was a collaborative effort among the U.S. Geological Survey, the Wisconsin Geological and Natural History Survey, and the Southeastern Wisconsin Regional Planning Commission. A complete description of the hydrologic study of southeastern Wisconsin including ground-water flow modeling is described in Feinstein and others, 2004. Additional information and documentation are available from the Wisconsin Geological and Natural History and from the website http://wi.water.usgs.gov/glpf/.
The computer model focused on a 10-county region in southeastern Wisconsin. The four easternmost counties border Lake Michigan. The model simulated the evolution of ground-water levels and flows between 1864 and 2000 for the entire flow system extending from shallow deposits consisting of near-surface sand, clay and dolomite to deeply buried units consisting mostly of sandstone (fig. 1).
Intensive ground-water use has affected the ground-water flow system throughout the region. Along with producing a large cone of depression, pumping over time has reduced flow from ground water to surface water (including Lake Michigan), shifted ground-water divides, increased leakage from the shallow to the deep parts of the ground-water-flow system, and changed the direction of ground-water flow. The primary purpose of the model was to quantify each of these changes in order to arrive at a better understanding of the state of the resource. A secondary purpose was to simulate trends using different assumptions about future pumping, climatic change, and land use.
Ground-water models require inputs that define the horizontal and vertical distribution of rock units, the water-bearing properties of the rocks, and the stresses that affect ground-water movement, notably recharge to the water table and pumping from wells open to shallow and (or) deep deposits. The ground-water-flow model for southeastern Wisconsin required more complicated input than usual because it integrated shallow ground-water flow, circulating mostly through fast, small-scale local systems where ground water discharges to streams and lakes, with slow, deep flow that extends over miles and typically discharges to Lake Michigan or high-capacity wells completed in the sandstones. Over the eastern half of the study area, a thick shale unit acts as a confining layer that severely limits circulation between the unlithified and dolomite deposits which constitute the shallow part of the flow system and the sandstones which constitute most of the deep part of the flow system. In the western half of the study area, the confining layer is absent and it is easier for vertical flow to replenish the deeper units. To simulate the entire flow system, 18 model layers associated with distinct rock types were defined. In addition to knowledge of shallow and deep ground-water levels, the different spatial and temporal scales of the shallow and deep components of flow required that the database used for the model input include both a dense network of surface-water bodies to accommodate the shallow flow and a good accounting of pumping wells at all depths to properly quantify the fraction of water that follows deep regional flow paths.
Ground-water-flow systems change with time, especially in the presence of pumping. The model was used to study the changes produced by increased pumping in southeastern Wisconsin from the late 1800s to 2000. Increased well withdrawals continue to affect the flow system as pumping centers shift and pumping depths change. Because of the time-dependent nature of flow in the ground-water system, it is not possible to simulate current conditions without first reproducing the evolution of ground-water flow starting from the natural, relatively stable conditions present before the first water-supply wells were dug. The model simulates this evolution with 16 sequential sets of pumping conditions averaging about 10 years in length.
To increase confidence in model simulation of changing water levels and flows, it was subjected to a testing procedure called calibration. In the case of the southeastern Wisconsin model, calibration took many forms. The availability of early water-level measurements in deep sandstone wells allowed the model results to be compared to conditions prior to large-scale ground-water development. Water levels from subsequent decades guided the adjustment of model inputs so that they matched the gradual response of the flow system to pumping. Streamflow measurements guided the choice of model inputs that control the balance between the amount of recharge entering the ground-water system at any location and the amount of ground water that discharges to nearby streams or other surface-water bodies.
Both the construction and calibration of the model depended largely on the availability of long-term data. The following sections describe these data in more detail.
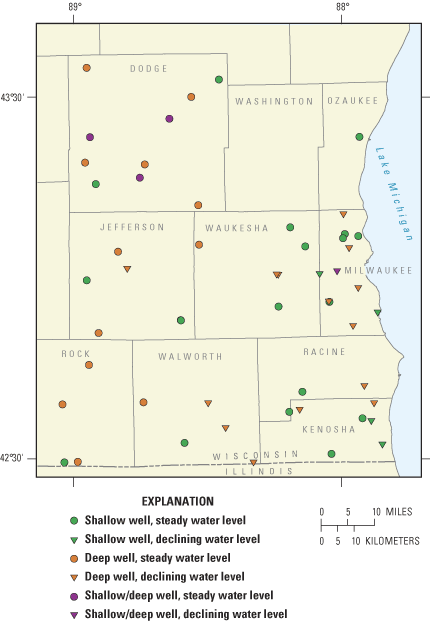
Historical water levels are available from 1940 to the present from about 50 wells in the Wisconsin Ground-Water Observation Well Network (http://wi.water.usgs.gov/gw). These wells provide the data needed to adjust inputs to the model so that the simulated water levels are close to those observed. Some wells in the calibration data set show stable water levels over their period of record, while others show declining levels in response to pumping (fig. 2). The model was adjusted to reproduce these trends.
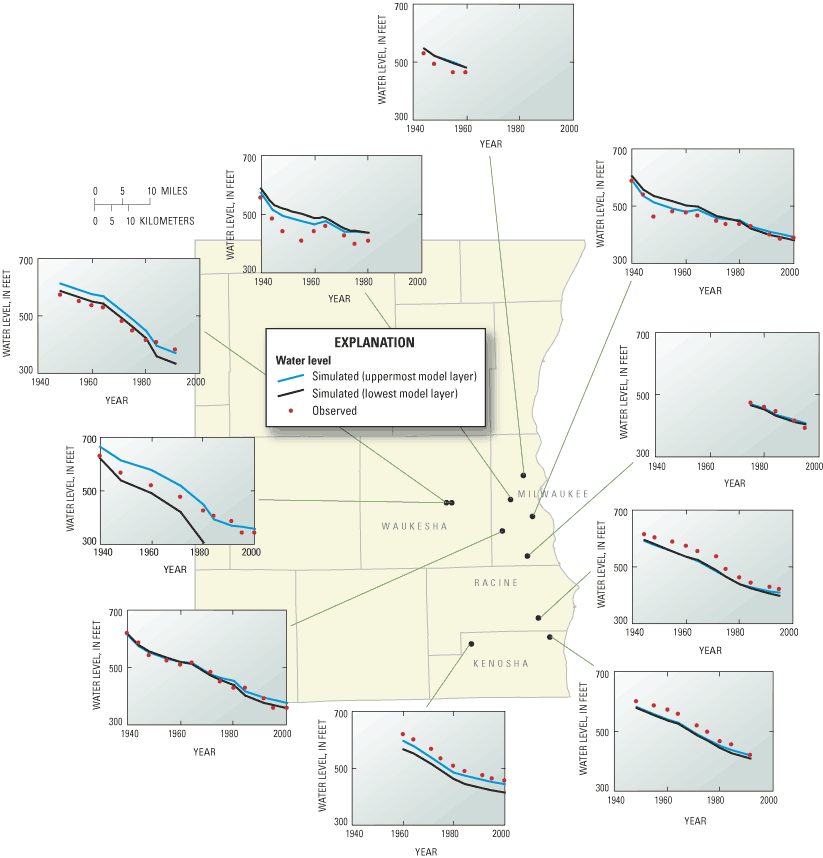
Within the observation-well network for southeastern Wisconsin, long-term records are available for 10 wells that are open to the deep ground-water system over one or more rock layers. The simulated water levels for these wells were calculated for the top and bottom model layers intersected by the well and then compared to the measured water levels (fig. 3). In general, the measured water-level trend for each well is similar to simulated trends. Throughout the study area, appreciable decreases in water levels over time were measured in the deep part of the flow system due to pumping. The model reflects the rate and magnitude of these decreases.
In addition to water levels, streamflows were used for model calibration. Streamflows measured at gaging stations are useful to calibrate a model because they provide a way to determine if the amount of ground water circulating in different parts of the simulated flow system is reasonable.
The streamflow measurements that serve as calibration targets for the regional model were derived from selected stations belonging to the USGS streamgaging network in southeastern Wisconsin (fig. 4, also see website: http://wi.water.usgs.gov/nwis/sw). These stations were selected because their historical records were long enough that a statistical analysis could be conducted to estimate the part of streamflow that is attributable to ground-water discharge across the streambed, a quantity referred to as base flow. In practice, it is difficult to calculate a single value for ground-water discharge to a stream, but a range of the long-term average base flow can be identified. The model-simulated base flows should fall within this range. In the case of the southeastern Wisconsin model, the base-flow calibration targets were met at most of the available gaging stations (fig. 5). The ability to reproduce base-flow estimates derived from analysis of long-term streamgaging data suggests that the model reasonably simulates the magnitude and direction of ground water that circulates through shallow flow systems to streams.
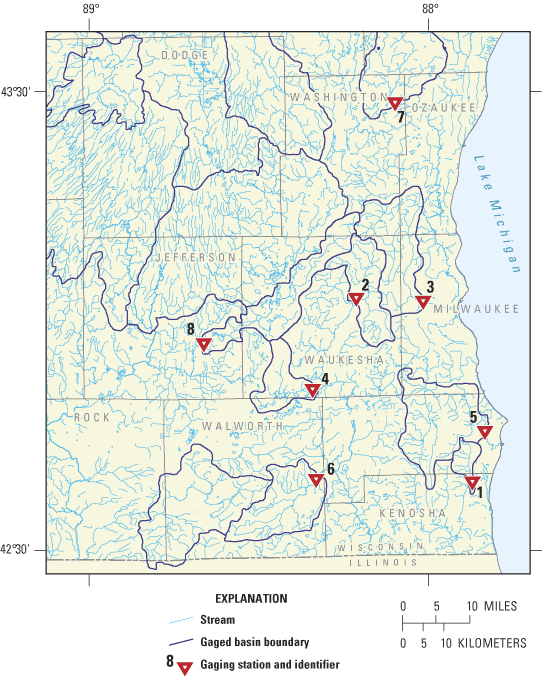
Figure 4. U.S. Geological Survey streamgaging network, southeastern Wisconsin.
Ground-water use was quantified by compiling pumping rates for individual high-capacity wells from 1864 to 2000. The compilation includes pumping rates for 794 high-capacity industrial, agricultural, and municipal wells for southeastern Wisconsin and 508 high-capacity wells representing pumping centers in surrounding areas in Wisconsin and Illinois. The water-use data were compiled from a number of published sources as well as from long-term records maintained by the Wisconsin Department of Natural Resources (WDNR) and by the Illinois State Water Survey. The data sources include two categories of pumping wells. The first consists of municipal high-capacity wells with generally complete withdrawal records. The second consists of industrial high-capacity wells with generally incomplete withdrawal records. Withdrawal rates from these wells must be estimated from pump-capacity data from individual well-construction reports on file with State agencies. Long-term records for domestic wells generally are not available. These wells number in the thousands over the study area, but typically they serve single households and discharge small volumes. Because most domestic wells pump from the shallow deposits, and then return the discharge to the subsurface through septic systems, their net withdrawal is not appreciable and they were not included in the model simulation.
The pumping history in the study area varies by county (fig. 6). Municipal and industrial pumping has decreased in some counties that have shifted from ground water to Lake Michigan water (for example, Milwaukee County), but has increased in other counties farther from the lake that have growing populations (for example, Waukesha County). Some counties rely heavily on shallow wells in sandy deposits near rivers (for example, Rock County) or fractured dolomite (for example, Ozaukee County), whereas withdrawals in others are focused on the deep sandstone units (for example, Jefferson County).
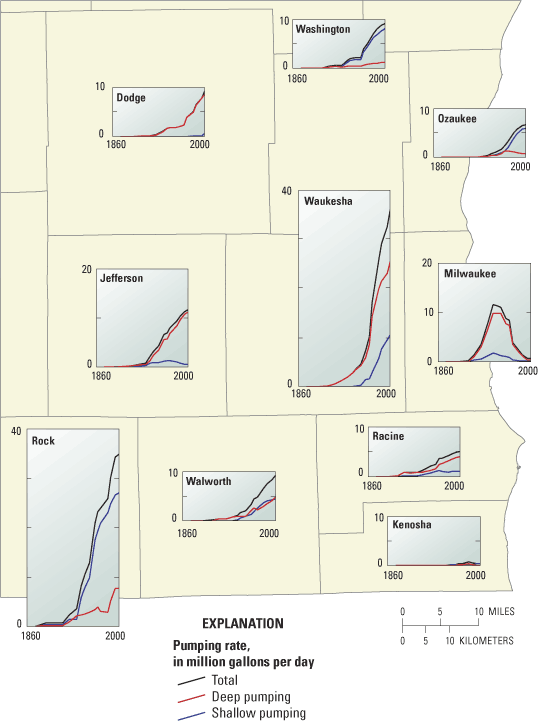
Key features of the pumping history are: 1) the geographic shift in the main pumping center from Milwaukee County westward to Waukesha County; and, 2) the increase in total withdrawals over time. The pumping history is reflected in the displacement and deepening of the regional cone of depression over time and in the migration of the deep ground-water divide marking the western boundary of the regional flow system in southeastern Wisconsin. Model results show that the area of contribution for deep wells has moved about 10 miles west of the natural divide as wells have diverted more water from shallow systems located far from the regional pumping centers (fig. 7).
The capacity of the model to track ground-water conditions over time depends on the availability of long-term data used in its construction and calibration. Once the model is calibrated to historical conditions, it can be applied to predict future conditions. In southeastern Wisconsin, the model has been used to simulate the future water-level response in the deep part of the flow system under the assumption that the distribution of all wells remains the same as in 2000, but that the withdrawals at each well will grow between 2000 and 2020 at a rate that matches recent overall trends. The additional simulated drawdown, shown in figure 8, is large enough to raise economic concerns (for example, increased cost of pumping with drawdown) as well as water-quality concerns (for example, adverse chemical reactions triggered by dewatering at the top of the deep part of the flow system). To reduce these potential adverse effects, part of deep pumping could be redistributed on a regional basis, replaced by shallow pumping, or replaced by diversions from surface water. The model currently is being used to study these management scenarios to guarantee an adequate water supply for southeastern Wisconsin.
Feinstein, D.T., Hart, D.J., Eaton, T.T., Krohelski, J.T., and Bradbury, K.R., 2004, Simulation of regional groundwater flow in southeastern Wisconsin: Wisconsin Geological and Natural History Survey Open-File Report 2004-01, 134 p.
Taylor, C.J. and Alley, W.M., 2001, Ground-water-level monitoring and the importance of long-term water-level data: U.S. Geological Survey Circular 1217, 68 p.
Document Accessibility: Adobe Systems Incorporated has information about PDFs and the visually impaired. This information provides tools to help make PDF files accessible. These tools convert Adobe PDF documents into HTML or ASCII text, which then can be read by a number of common screen-reading programs that synthesize text as audible speech. In addition, an accessible version of Acrobat Reader 6.0, which contains support for screen readers, is available. These tools and the accessible reader may be obtained free from Adobe at Adobe Access.
| AccessibilityFOIAPrivacyPolicies and Notices | |
 |
|