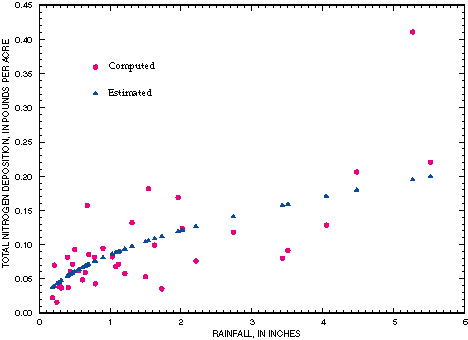
Figure 3. Comparison of computed and estimated (from regression) total nitrogen deposition for selected rainfall events, Coastal Bend area, south Texas, 1996–98.
Contents | Text