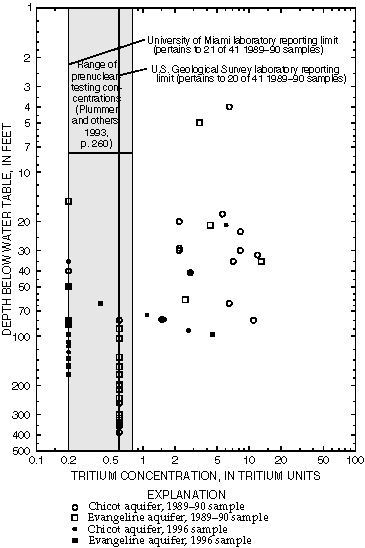
Figure 3. Depth below water table of environmental tritium concentrations in samples from selected wells, 1989–90 and 1996 studies, Chicot and Evangeline aquifers near Houston, Texas.
Back to Contents | Back to Text