
U.S. Geological
Survey Fact Sheet 030-01
Online version 1.1
Did
You Feel It?
Community-Made Earthquake Shaking Maps
|
Since the early 1990's, the magnitude and location of an earthquake have been available within minutes on the Internet. Now, as a result of work by the U.S. Geological Survey (USGS) and with the cooperation of various regional seismic networks, people who experience an earthquake can go online and share information about its effects to help create a map of shaking intensities and damage. Such "Community Internet Intensity Maps" (CIIM's) contribute greatly in quickly assessing the scope of an earthquake emergency, even in areas lacking seismic instruments. |
Not long ago, the first thing that most people did after feeling an earthquake was to turn on their radio for information. Recently, however, after the Hector Mine earthquake in southern California and after a widely felt earthquake in upstate New York, many people logged onto the Internet instead, not only to get information, but also to share their own experience of the earthquake. After checking the U.S. Geological Survey (USGS) website for the location and magnitude of the earthquake, they went to a webpage called "Did You Feel It?". They entered their ZIP code and answered a list of questions such as "Did the earthquake wake you up?"and "Did objects fall off shelves?" In minutes a map began taking shape on the Internet, and in a couple of hours, with more than several thousand responses for the southern California event, a Community Internet Intensity Map (CIIM) showed where and how strongly the earthquake had been felt.
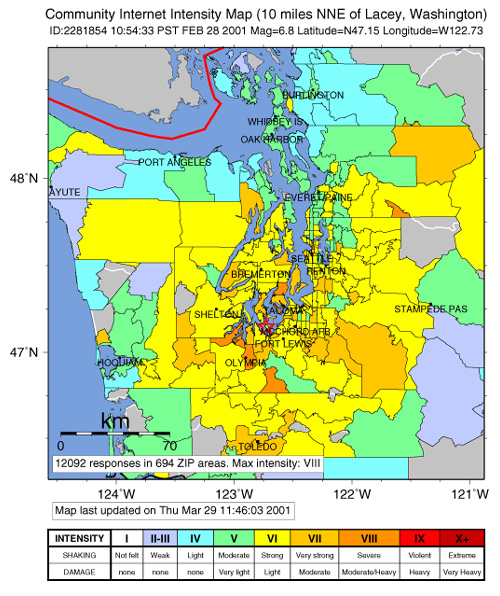 |
Community Internet Intensity Map (CIIM) for the February 28, 2001, magnitude 6.8 Nisqually, Washington, earthquake as of early April, 2001. Early estimates were that at least $2 billion in damage occurred in the Seattle region. Star shows epicenter, and colored areas on the map indicate the intensity for that ZIP-code area, as described in the key. White lines are major roads. |
The measure of shaking and damage from an earthquake is called "seismic intensity." In general, the intensity decreases with increasing distance from the earthquake. However, a variety of factors, such as the type of earthquake, rupture direction, local geography, soil conditions, and type and age of buildings, result in an often complicated pattern of varying intensities from place to place. Since 1931, the USGS has been assigning intensities to earthquakes in the United States on the basis of the Modified Mercalli Intensity (MMI) scale. Typically, this is done by collecting responses to a postal questionnaire that is sent to each post office near the earthquake, and to a sparser sample of post offices with increasing distance from the earthquake. This way of preparing a seismic intensity map can take months to complete.
In contrast to the old method, CIIM's take advantage of the Internet to generate initial intensity maps almost instantly. Data are received through a questionnaire on the Internet answered by people who actually experienced the earthquake, reducing the process of preparing and distributing a shaking intensity map from months to minutes.
A CIIM summarizes the responses, and an intensity number is assigned to each ZIP code for which a CIIM questionnaire is completed. The intensity values in each ZIP-code area are averaged, and the map is updated as additional data are received. ZIP-code areas for which data have been received are color-coded according to the intensity scale below the map; other areas are gray. A CIIM is automatically made after each widely felt earthquake in the United States. The system can start receiving responses within about 3 minutes after the earthquake. Internet users can also enter data for U.S. earthquakes they have experienced in the past.
CIIM values have been calibrated to be, on average, similar to MMI values. Comparisons between traditional MMI values obtained by using postal questionnaires and CIIM values show that they agree well except in areas of low shaking, where the CIIM values tend to be more reliable.
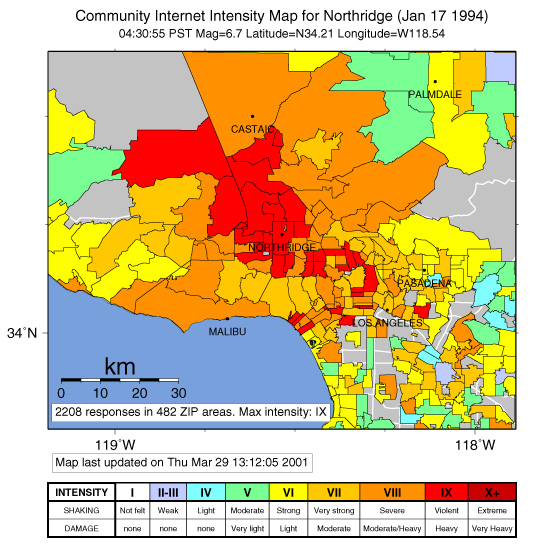 |
Community Internet Intensity Map for the January 17, 1994, magnitude 6.7 Northridge, California, earthquake as of early April, 2001. This earthquake killed 57 people and caused more than $20 billion in damage in the Los Angeles region. Star shows epicenter, and colored areas on the map indicate the intensity for that ZIP-code area, as described in the key. White lines are major roads. CIIM data for the Northridge earthquake were collected beginning 3 years after the event. CIIM's are now being created immediately after earthquakes throughout the United States. |
How is an earthquake like a lightbulb?The magnitude, or size, of an earthquake is like the wattage of a lightbulb. Just as the wattage represents the amount of power of the lightbulb, the magnitude is related to the total amount of energy released by the earthquake source. It is based on the amplitude of the earthquake waves recorded on instruments that have a common calibration. The magnitude of an earthquake is thus represented by a single, instrumentally determined value. The intensity, or shaking level, is like the amount of light from a lightbulb that is received at any spot in a room. A lightbulb in one corner of a room will make that corner bright (a high intensity value), but it will leave the opposite corner of the room dim (a low intensity value). Intensity is based on the observed effects of ground shaking on people, buildings, and natural features. Like the brightness of light in a room, the intensity generally decreases as one moves away from the fault, but other factors such as rupture direction and soil type also influence the amount of shaking. It also varies from place to place within the disturbed region, depending on the location of the observer with respect to the earthquake epicenter. Roman numerals are often used to describe intensities to distinguish them from magnitudes. The Modified Mercalli Intensity scale is currently used in the United States. For example, the magnitude of the October 16, 1999, Hector Mine, California, earthquake was 7.1, and the shaking intensities ranged from VII (very strong) in towns nearest the epicenter to II-III (weak) at distances as much as 300 miles (500 km) away. |
|
In regions with few earthquakes and, hence, few seismic instruments, which includes most of the United States and most of the world, large numbers of intensity observations for a small to moderate event can indicate which areas will be more prone to shaking in the less frequent larger earthquakes.
After a damaging earthquake in those sparsely instrumented areas, CIIM's can provide information about which areas experienced the most shaking and therefore the most potential damage. This information can serve as a post-earthquake response tool and for estimating losses from future earthquakes.
In areas such as California where there are networks of seismic instruments, CIIM's provide a very rapid means of displaying the pattern of shaking independently of strong-motion seismographs. CIIM's provide descriptions of actual damage, rather than inferred potential damage indicated by instrumental shaking records. Also, the potential number of Internet responses far exceeds the number of seismic instruments, so very dense sampling of earthquake effects can be collected, providing details that would not be possible with the instruments alone. Eventually, the automated use of voluntary Internet contributions for the collection of intensity data following an earthquake will significantly reduce the manpower required to collect and interpret intensity observations.
Finally, the interactive nature of the Internet-based questionnaire and mapping provides an unprecedented opportunity for community involvement. The CIIM interactive website pro-vides an avenue for feedback among the communities affected by earthquakes, the scientists studying their effects, and agencies responding to the events. The CIIM website allows people in an area struck by an earthquake to share their experiences, and this type of communication after a stressful event is an important tool for dealing with the emotional impact of such an experience.
Most areas of the United States, even many of those prone to earthquakes, do not have dense seismic networks. For such areas, CIIM's provide the only rapid way to assess the distribution of shaking intensities and levels of damage. This quick information can aid in making the most effective use of emergency response resources and assist in preparing for future earthquakes. The work of the USGS and its cooperators in developing CIIM's are only part of the ongoing USGS efforts to protect lives and property from future earthquakes throughout the United States.
David Wald, Lisa Wald, James Dewey, Vince Quitoriano, and Elisabeth Adams
Graphic design by Lisa Wald
For More
Information
Earthquake Hazards Program
U.S. Geological Survey
DFC P.O. Box 25046, MS-966
Denver, CO 80225
Visit the website for the USGS Earthquake Hazards Program
Community Internet Intensity Maps are available at the USGS "Did you Feel It?" website
Download this Fact Sheet as a PDF document (498 kB)
REDUCING EARTHQUAKE LOSSES THROUGHOUT THE UNITED STATES
Download a free copy of the latest version of Adobe Reader.
For questions about the content of this report, contact David Wald
URL of this page:
https://pubs.usgs.gov/fs/fs030-01/
Maintained by: Michael Diggles
Created: April 27, 2001
Last modified: January 12, 2010 (mfd)