On July 5, 2002, starting at about 8 a.m., the southern half of the eye of Typhoon Chata'an passed directly over the northern part of the island of Guam. Data collected on Guam indicate that the typhoon had sustained winds of 85 to 90 miles per hour (mi/hr) with gusts of up to 115 mi/hr (Charles Guard, National Weather Service, written commun., 2003). Storm rainfall totals exceeded 21 inches (in.) over the mountainous areas in south-central Guam. During the peak of the storm, rain fell at rates of up to 6.48 inches per hour (in/hr). Because of the damage caused by Typhoon Chata'an, the President signed a major disaster declaration on July 6, 2002.
Damages associated with Typhoon Chata'an, while considered moderate relative to other storms that have affected Guam, amounted to several tens of millions of dollars. In excess of 1,000 single-family and multi-family homes were either extensively damaged or destroyed. Electrical power was out for several days over most of the island and no potable water was available through public distribution systems (Federal Emergency Management Agency, 2002). The extreme rainfall led to flooding in southern Guam and caused numerous landslides and severe erosion along water courses. The most significant evidence of these effects could be found in the Fena Valley Reservoir, where elevated sediment concentrations made the water unsuitable for use as a domestic water supply for several days. During normal operation, Fena Valley Reservoir supplies most of the drinking water for the military and some of the general public in southern Guam. All of the stream-gaging stations operated by the U.S. Geological Survey (USGS) on Guam were damaged to some extent during the flood and three of the stations were totally destroyed.
Peak flows in many rivers in southern Guam reached record levels during Typhoon Chata'an. New record peak stages and/or flows of record occurred at 14 of 15 sites where the USGS has collected data. In some areas, the magnitude of flood peaks exceeded previous records significantly. Peak flows had recurrence intervals of 80 years or more at 9 of the 13 sites where sufficient data were available to make the computations. Four of the 9 sites had recurrence intervals that were determined to be greater than 100 years.
In this fact sheet, storm rainfall totals and maximum rainfall totals for durations of 1-, 3-, 6-, and 12-hours are summarized for 12 rain gages on Guam. Peak stages and/or flows were computed at 15 USGS streamflow-gaging stations and recurrence intervals for the peaks determined. Rainfall and streamflow-gaging stations operated by the USGS on Guam are supported by funding provided by numerous agencies including the U.S. Navy, the U.S. Army Corps of Engineers (USACE), and the University of Guam through the Water and Environmental Research Institute (WERI). The USGS Office of Surface Water, as part of a national program to document the effects of extreme floods in the United States, provided funding to support the preparation of this fact sheet.
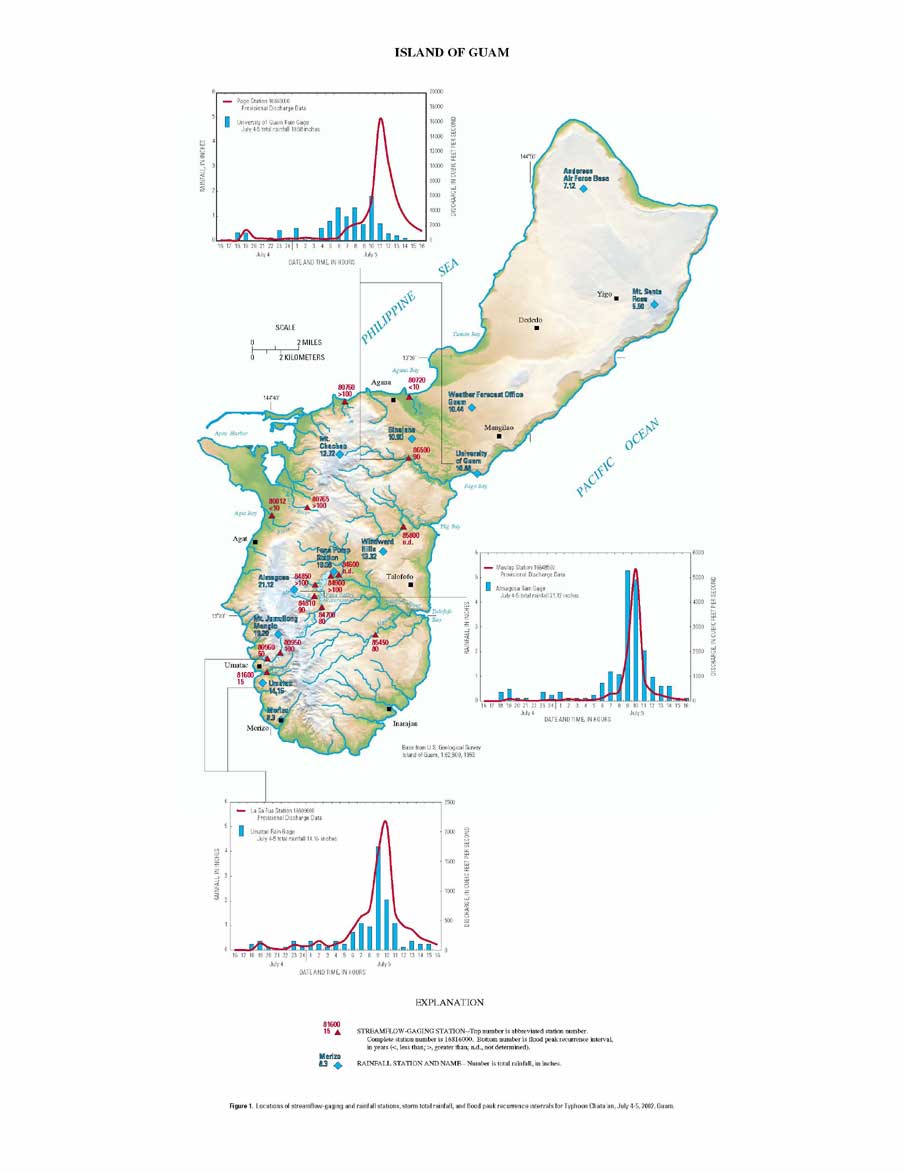
Total rainfall for the period of the storm (July 4-5, 2002) and maximum rainfall totals for durations of 1-, 3-, 6-, and 12-hours at 12 rain gages are shown in table 1. Included in table 1 are data for 7 USGS rain gages, provisional data for 3 National Weather Service (NWS) rain gages (Charles Guard, National Weather Service, written commun., 2003), and provisional data for 2 rain gages operated as part of the Tropical Rainfall Measuring Mission (TRMM) (Mark Lander, University of Guam Water and Environmental Research Institute, written commun., 2003). The locations of the 12 gages and total rainfall for July 4-5, 2002 are shown in figure 1.
Storm rainfall totals for Typhoon Chata'an exhibited a distinctive pattern. The northern part of Guam received less than 10 in. of rain, and rainfall totals gradually increased to values of 10 to 13 in. in the central part of the island. Further south there is a sharp gradient in rainfall totals between the central part of the island and the upland areas of south-central Guam, especially in the vicinity of the Fena Valley Reservoir, where rainfall totals of 19 to 21 in. were recorded. Rainfall totals drop off sharply in the extreme southern part of the island. Rainfall totals at Mount Jumullong Manglo, Umatac, and Merizo rain gages were 19.20, 14.16, and 8.3 in., respectively. This rainfall pattern is evident from the data in figure 1 and in table 1, which lists the gages from north to south.
The pattern of storm total rainfall is a direct response to the path followed by Typhoon Chata'an across Guam. During the passage of a typhoon, the areas within the eye of the storm receive lesser amounts of rainfall and areas just outside the eye in the eye wall of the storm receive the maximum amounts of rainfall. Rainfall totals diminish with increasing distance away from the outer edge of the eye wall (Mark Lander, University of Guam Water and Environmental Research Institute, oral commun., 2003). The southern half of the eye of Typhoon Chata'an passed directly over the northern part of Guam. The distribution of rainfall totals indicates that the southern edge of the eye passed near the central part of the island in the area where dramatic increases in rainfall were recorded.
Maximum rainfall intensities during the storm show the same pattern as total rainfall. Rain gages in north-central Guam recorded maximum 1-hour rainfall totals that ranged from 1.17 in. at Mount Santa Rosa to 2.64 in. at Andersen Air Force Base. The Almagosa rain gage, near the Fena Valley Reservoir, recorded a maximum 1-hour total of 6.48 in. Further to the south intensities diminished with a maximum 1-hour rainfall total of 2.24 in. recorded at Merizo. The distribution of hourly rainfall during the storm at the University of Guam, Almagosa, and Umatac rain gages is shown in figure 1. Rainfall at the University of Guam gage, which is in an area that was likely within the eye of the storm, lacks the significant spikes of high rainfall intensities recorded at the Almagosa and Umatac gages, which were both in an area to the south of the eye in the eye wall of the typhoon.
Maximum rainfall intensities were recorded between 8 and 10 a.m. (fig. 1). This period corresponds with the time when the eye of the typhoon reached and transversed the northern part of the island. In the areas of the typhoon eye wall, the period of maximum rainfall intensities likely corresponded to times when wind speed was high. It is well documented that rain gages under-register rainfall in windy conditions and that the magnitude of this error increases with wind speed; Larson and Peck (1974) reported rainfall catch deficiencies of about 20 percent at winds speeds of 20 mi/hr. Wind speeds during the passage of the typhoon and the periods of maximum recorded rainfall intensities were likely to have been significantly greater than 20 mi/hr. Actual maximum rainfall intensities were therefore likely to have been much greater than the intensities recorded.
As part of this study, peak flows and/or peak stages were determined at 15 current or former USGS stream gages in Guam. The peak flow and stage data are summarized in table 2 and the locations of the gages are shown in figure 1. Northern Guam has essentially no stream drainage because the area is composed primarily of permeable limestone through which rainfall rapidly infiltrates and there is little or no surface water runoff (Ward and others, 1965). Southern Guam has a dense network of streams because the area is composed primarily of volcanic rocks with limited infiltration capacities. During the Typhoon Chata'an storm, rainfall totals were in excess of 10 in. over most of southern Guam, generating significant volumes of surface-water runoff. Peaks flows and/or stages in this area exceeded previous maximums at 14 of the 15 USGS stream gages where flood measurements were made.
During the peak of the storm, it was neither safe nor practical to make direct measurements of peak flows and stages. As a result, a variety of indirect methods based on hydraulic models and hydrologic techniques were used to compute peak stages and flows. The indirect methods used are site specific and had to be tailored to the conditions at each of the USGS stream gages where computations were made (Rantz and others, 1982, chapter 9).
The peak stage recorded at the Ylig River stream gage was 23.45 feet (ft), 4.82 ft higher than the previous maximum level recorded since 1953. The peak stage recorded in the Fena Valley Reservoir was 5.36 ft above the spillway crest and 0.86 ft higher than the previous maximum recorded since 1953. The pattern of maximum peak flows closely corresponds to the distribution of rainfall over Guam. For example, the Umatac River was one of the two sites where a new record peak flow was not established during the typhoon. This is also an area where rainfall totals declined sharply from the areas just to the north. USGS stream gages located in the vicinity of the Fena Valley Reservoir had particularly high peak flow rates. USGS stream gages have been operated on the Almagosa and Maulap Rivers since 1972 and on the Ugum River since 1977. The previous peak flows of record for these gages took place in 1978 and 1980 when the Almagosa River peaked at 2,650 cubic feet per second (ft3/s), the Maulap River peaked at 2,420 ft3/s, and the Ugum River peaked at 5,890 ft3/s. Peak flow rates during Typhoon Chataan on the Almagosa, Maulap, and Ugum Rivers of 6,330 ft3/s, 5,340 ft3/s, and 14,700 ft3/s are 239, 221, and 250 percent greater than the previous records.
The distribution of streamflow during Typhoon Chata'an is shown in the plots of hourly discharge included in figure 1 for the Pago River, Maulap River, and La Sa Fua River stream gages. Flow at these selected stream gages responds quickly to periods of high rainfall intensity. At each of the stream gages the sharp increase in flows coincides closely with the onset of the periods of maximum rainfall intensities. The peak flow rates at the three stream gages took place within an hour of the end of the maximum rainfall intensities. Streamflow dropped off sharply from the peaks in conjunction with the rapid reductions in rainfall.
The recurrence intervals associated with the flood peaks were computed following the guidelines outlined in Bulletin 17B (Interagency Advisory Committee on Water Data, 1982). Because a generalized map skew has not been computed for Guam, the analyses were based on the station skew at each of the stream gages. At five USGS stream gages, sufficient data to compute recurrence intervals were not available. For those gages the recurrence intervals were estimated using computations summarized in a published flood insurance study for Guam (Federal Emergency Management Agency, 1998). Recurrence intervals were not computed for the Tolaeyuus and Ylig Rivers because peak flow computations for Typhoon Chataan could not be made at those sites.
The recurrence interval is an estimate of the average number of years between floods of a magnitude that equal or exceed the computed value. For example, a peak flow with a recurrence interval of 100 years is one that would be equaled or exceeded, over the long term, an average of once every 100 years. An alternative way to view the recurrence interval is to take its reciprocal (for example 100 years becomes 1/100 or 0.01), which yields the annual exceedance probability. Therefore, a 100-year flood has an annual exceedance probability of 0.01, or a 1 percent chance of being equaled or exceeded in any given year.
The computed recurrence intervals in years are summarized in table 2 and are shown in figure 1. With the exception of four stream gages, the computed recurrence intervals were greater than or equal to 80 years. The recurrence intervals at the lower La Sa Fua, Umatac, and Agana River stream gages were 50, 15, and less than 10 years, respectively. These stream gages are located in areas that received less rain than the upland areas of south-central Guam. A recurrence interval of less than 10 years was computed for the Namo River. No rainfall data were available in the immediate area to either support or contradict this apparent outlier. Recurrence intervals were determined to be greater than 100 years for the Asan, Aplacho, and Maulap River and Fena Valley Reservoir gages.
| Rainfall gage | 1 hour | 3 hours | 6 hours | 12 hours | July 4-5 |
|---|---|---|---|---|---|
| Andersen Air Force Base (TRMM gagea) | 2.64 | 4.14 | 4.82 | 6.40 | 7.12b |
| Mount Santa Rosa (USGS gage 133209144545301) | 1.17 | 1.91 | 2.36 | 3.39 | 5.50 |
| Weather Forecast Office, Guam (NWS gagec) | 2.48 | -- | 5.27 | 8.64 | 10.44 |
| Sinajana (NWS gagec) | -- | -- | -- | -- | 10.90 |
| University of Guam (TRMM gagea) | 2.33 | 3.84 | 6.97 | 9.17 | 10.88 |
| Mount Chachao (USGS gage 132617144423366) | -- | -- | -- | -- | 12.72d |
| Windward Hills (USGS gage 132234144441966) | 3.24 | 6.48 | 8.64 | 10.44 | 13.32 |
| Fena Reservoir Pump Station (USGS gage 132132144422366) | 5.64 | 10.56 | 13.92 | 16.08 | 19.08 |
| Almagosa (USGS gage 132105144405166) | 6.48 | 12.24 | 15.60 | 17.88 | 21.12 |
| Mount Jumullong Manglo (USGS gage 131921144401301) | 5.88 | 10.80 | 13.68 | 15.96 | 19.20 |
| Umatac (USGS gage 131729144393766) | 4.20 | 7.44 | 10.08 | 11.76 | 14.16 |
| Merizo (NWS gagec) | 2.24 | -- | 5.89 | -- | 8.3e |
| Previous record | July 5, 2002 | |||||||
|---|---|---|---|---|---|---|---|---|
| Station number | Station name | Peak flow (ft3/s) | Peak stage (feet) | Date of previous peak | Period of peak records | Peak flow (ft3/s) | Peak stage (feet) | Recurrence interval (years) |
| 16807200 | Agana River at Agana (CSG) | 600 | n.a. | 09/06/1985 | 1985-1989 | 1,720 | n.a. | <10a |
| 16807600 | Asan River at Asan (CSG) | n.a. | 10.10 | 11/03/1997 | 1997-2002 | 3,920 | 12.27 | >100a |
| 16807650 | Aplacho River at Apra Heights | 929 | 23.55 | 09/07/2000 | 2000-2002 | 1,690 | 25.22 | >100b |
| 16808120 | Namo River at Santa Rita (CSG) | 1,220 | n.a. | 09/11/1989 | 1985-1989 2002 | 1,810 | 9.60 | <10b |
| 16809500 | La Sa Fua River near Agat | n.a. | n.a. | n.a. | 2002 | 1,980 | 13.5 | 100b |
| 16809600 | La Sa Fua River at 310 feet near Umatac | 1,440 | 6.05c | 09/27/1978 | 1954-1960 1977-1983 2000-2002 | 2,140 | 17.73 | 50 |
| 16816000 | Umatac River at Umatac | 7,460 | 7.04 | 10/19/1960 | 1954-1976 2002 | 6,240d | 10.75d | 15 |
| 16846000 | Tolaeyuus River at mouth | n.a. | 20.47 | 12/17/1997 | 1994-1995 1997-2002 | n.d. | 28.06 | n.d. |
| 16847000 | Imong River near Agat | 6,100 | 11.30 | 09/27/1978 | 1961-2002 | 5,920d | 13.53d | 80 |
| 16848100 | Almagosa River near Agat | 2,650 | 7.78 | 09/27/1978 | 1972-2002 | 6,330 | 10.80 | 90 |
| 16848500 | Maulap River near Agat | 2,420 | 9.20 | 09/27/1978 | 1972-2002 | 5,340 | 11.23 | >100 |
| 16849000 | Fena Dam Spillway near Agat | n.a. | 4.50 | 10/15/1953 | 1953-2002 | n.a. | 5.36 | >100e |
| 16854500 | Ugum River above Talofofo Falls | 5,890 | 14.2 | 02/26/1980 | 1977-2002 | 14,700 | 21.50 | 80 |
| 16858000 | Ylig River near Yona | 3,410 | 18.63 | 12/16/1997 | 1953-1998 | n.d. | 23.45 | n.d. |
| 16865000 | Pago River near Ordot | 10,100 | 20.15 | 05/21/1976 | 1952-1982 1999-2002 | 16,500 | 23.55 | 90 |