Figure 3. Graphs showing concentrations of total PAHs, ratios of PAH assemblages, and ratios of pristane to phytane in surficial sediments and cores. MER core samples are shown by circles, and SY core samples by triangles. (NA: not applicable, as pristane was below the detection limit.)

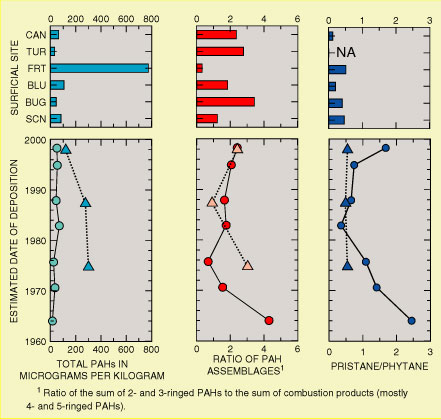
Figure 3.  Concentrations of total PAHs, ratios of PAH assemblages, and ratios of pristane to phytane in surficial sediments and cores. MER core samples are shown by circles, and SY core samples by triangles. (NA: not applicable, as pristane was below the detection limit.)

Back to Contents | Figure 4