

|
|
|
U.S. Geological Survey
Fact Sheet 095-02
Online Version 1.0
Vulnerability of U.S. National Parks to Sea-Level Rise and Coastal Change
By E. Robert Thieler, S. Jeffress Williams, and Rebecca Beavers
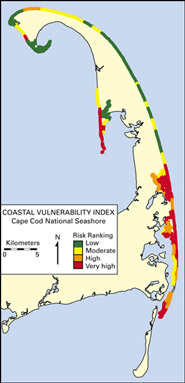
Figure 1. Map of the coastal vulnerability index (CVI) for Cape Cod National Seashore in Massachusetts showing the relative vulnerability of the coast to changes in sea level. Areas along the coast are assigned a ranking from low to very high risk, based on the analysis of physical variables that contribute to coastal change. |
|||
One of the most important and practical issues in coastal geology is determining the physical response of coastal environments to water-level changes. Two trends may affect shorelines in U.S. national parks: rising global sea level and falling Great Lakes water levels.
Global sea level has risen about 18 centimeters (7.1 inches) in the past century (Douglas, 1997). Computer models suggest that climate change will cause an additional rise of 48 cm (18.9 in.) by the year 2100 (Intergovernmental Panel on Climate Change, 2001), which is more than double the rate of sea-level rise over the past century. Thus, sea-level rise is expected to have a large, sustained impact on future coastal evolution. Potential effects include coastal erosion, saltwater intrusion into ground-water aquifers, inundation of wetlands and estuaries, and threats to cultural and historic resources, as well as park infrastructure.
Water levels in the Great Lakes have fluctuated over the past century by as much as 1.9 meters (6.2 feet). Changing climate is predicted to cause lake levels to decline by as much as 2.4 m (7.9 ft) over the next century (Great Lakes Regional Assessment Group, 2000). Potential effects include reducing areas accessible to cargo and recreational boats, exposing toxic sediments, and declining production of plankton that support fish.
|
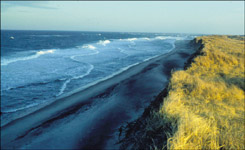
Figure 2. A narrow beach and eroded dunes result from a recent winter storm at Coast Guard Beach, Cape Cod National Seashore, Mass. Photograph courtesy of the National Park Service. |
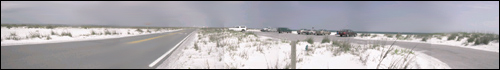
Figure 3. Most of the Gulf Islands National Seashore, Miss. and Fla., is composed of low-lying barrier islands. In many locations, you can see from the ocean to the sound, as shown above. A combination of variables makes this seashore highly vulnerable to predicted sea-level rise. Photograph by Erika Hammar-Klose, USGS. |
Some park areas that are at the greatest risk are also culturally significant or very popular. In Gulf Islands National Seashore, Civil War-era Fort Massachusetts is at great risk because of high rates of erosion, the low-sloping coastal plain, and the low-lying barrier island morphology. In contrast, most of Cape Cod National Seashore's infrastructure is located on high-elevation uplands away from the shore, and most high-visitor-use areas are accessible primarily by foot.
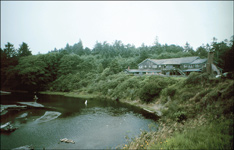
National Park Service staff are using the CVI data for long-term resource management plans, park facilities planning such as relocating coastal buildings or roads, and assessing long-term threats to cultural resources. For example, data from the Olympic National Park CVI study were used to identify vulnerable infrastructure and implement plans to relocate the Kalaloch Lodge (fig. 4). The data are also being integrated into the park's general management plan, the primary long-term planning document for the park. Future work for this cooperative project between the USGS and the NPS will map the coastal vulnerability index at additional parks throughout the United States and U.S. territories.
| Figure 4. Kalaloch Lodge in Olympic National Park, Wash., is threatened by erosion. Long-term plans call for moving the lodge back from the cliff edge. Photograph by Erika Hammar-Klose, USGS. |
|
Great Lakes Regional Assessment Group, 2000, Preparing for a changing climate; The potential consequences of climate variability and change—Great Lakes overview (edited by P.J. Sousounis and J.M. Bisanz): Ann Arbor, MI, University of Michigan, 106 p.
Hammar-Klose, E.S., and Thieler, E.R., 2001, Coastal vulnerability to sea-level rise; A preliminary database for the U.S. Atlantic, Pacific, and Gulf of Mexico coasts: U.S. Geological Survey Digital Data Series DDS-68, one CD-ROM (Available online at https://pubs.usgs.gov/dds/dds68/)
Intergovernmental Panel on Climate Change, 2001, Climate change 2001; The scientific basis, contribution of Working Group I to the third assessment report of the Intergovernmental Panel on Climate Change: Cambridge, England, Cambridge University Press, 944 p. (Available online at http://www.ipcc.ch/)
E. Robert Thieler and S. Jeffress Williams
U.S. Geological Survey
384 Woods Hole Road
Woods Hole, MA 02543-1598
E-mail: rthieler@usgs.gov, jwilliams@usgs.gov
Telephone: 508-548-8700
Web: http://woodshole.er.usgs.gov/project-pages/nps-cvi/
Rebecca Beavers
National Park Service
Natural Resource Program Center
Geologic Resources Division
P.O. Box 25287
Denver, CO 80225-0287
E-mail: Rebecca_Beavers@nps.gov
Telephone: 303-987-6945