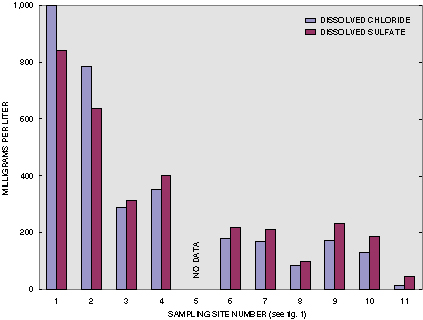
Figure 3. Median dissolved chloride and sulfate at lower Red River (main stem) Basin sampling sites decrease in concentration through the basin, 1997–98.
Back to Contents | Back to Text