
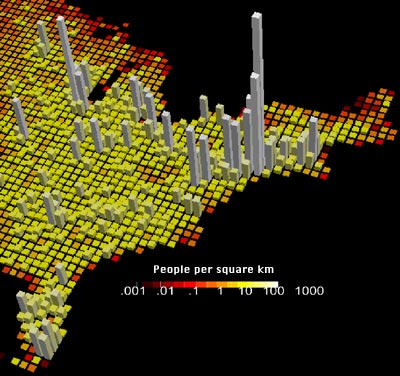
Figure 1. Population density of the eastern United States. Polluted sediments occur in the coastal ocean near major population centers. Fifty percent of the U.S. population lives within 50 miles of the coasts; about 80% within 200 miles. The New York-New Jersey region is one of the largest population centers. |
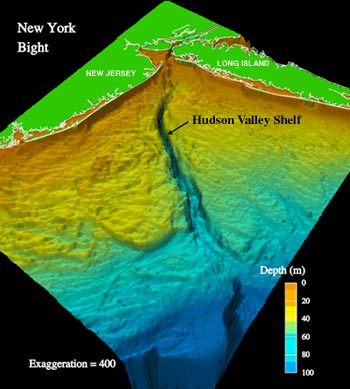
Figure 2. Bathymetry of the coastal ocean in the New York-New Jersey metropolitan region. The sandy, relatively shallow mid-Atlantic continental shelf is bisected by the Hudson Shelf valley, a submerged river valley containing muddy sediments that may act as a conduit for cross-shelf transfer of sediments. |
The U.S. Geological Survey's Coastal and Marine Geology Program is conducting a long-term multidisciplinary study in the New York-New Jersey region to characterize the sediments on the sea floor, map the distribution of contaminants in the sediments, and develop a predictive model for the long-term transport and fate of sediments and contaminants. This regional understanding of the sea-floor geology and dynamics of these coastal sediments is needed by Federal, State, and local agencies for management and use of the coastal ocean, and by scientists to plan and conduct research and monitoring.
The distribution of contaminants in sediments and changes in their patterns observed over time have been used to identify dispersal and deposition patterns, transport rates, and to ascertain the potential of the affected sediments for inducing toxic effects in biota. Chemical and physical analyses of sediment samples were combined with seismic data to provide a three-dimensional assessment of contaminant distribution in the region. Many contaminants adhere to particles and move with the sediments in the marine environment. The distribution patterns measured for one particle-reactive contaminant are often similar to those of another contaminant that has similar sources. Consequently, areas where lead concentrations are high (fig. 3) also have high concentrations and inventories of many other pollutants.
[Click on thumbnail to open larger
|
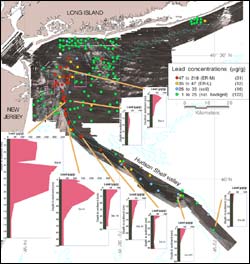
Figure 3. Map of the sea-floor near the New York-New Jersey metropolitan region showing features from sidescan sonar and multibeam backscatter data (gray scale), lead concentrations in surface sediments (dots), bathymetry (blue lines), and dump sites (pink boxes). Surface concentrations are colored relative to toxicity levels: red is most toxic (ER-M=218 µg/g) and green represents values below natural background (25 µg/g). Number of samples in each category is shown in parentheses. Subsurface accumulation of lead is shown in a series of inset core profiles (concentrations below 25 µg/g in brown and elevated concentrations in red). |
Metal and bacterial contaminants measured in sediment samples indicate widespread pollution on the broad, sandy shelf and in the muddy sediments of the Hudson Shelf valley. The highest concentrations occur in muddy deposits near dump sites and in the northern basins of the upper Hudson Shelf valley. More than 10 percent of the sewage sludge dumped is found in the upper valley. Metal concentrations show that sediment is migrating away from the dump sites as far as 80 km down the valley (fig. 3). These pools of pollutants are an ongoing source of contaminants and carbon to the New York Bight. Monitoring the sediment record over time shows decreasing concentrations of contaminants in sediments near the disposal sites. This decrease is a result of improvements in disposal practices and removal of the finer sediments from the sandy shelf by winnowing. Despite disposal regulations and the cessation of dumping, the data suggest that sediments are continually redistributed by currents and biological processes. Mixing in the sediments allows contaminated material to be accessible to benthic organisms.
Future success in managing a sustainable ecosystem will rely on continued efforts to (1) characterize affected areas, (2) identify physical and biological processes, (3) provide appropriate data syntheses, and (4) involve the public. Pollution in the New York Bight occurs on a much larger scale than near smaller urban centers and studies here can be used to guide studies and regulation elsewhere.
Ellen L. Mecray, Marilyn Buchholtz ten Brink, or Bradford Butman
U.S. Geological Survey
Woods Hole Field Center
384 Woods Hole Road
Woods Hole, MA 02543-1598
phone: (508) 548-8700
fax: (508) 457-2309
E-mail: mtenbrink@usgs.gov