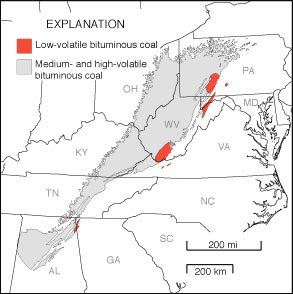
Figure 1. The Appalachian basin coal region. The USGS assessment is focused in the northern and central parts of the Appalachian coal region (Kentucky, West Virginia, Virginia, Maryland, Pennsylvania, and Ohio) because about 93 percent of Appalachian coal is produced here. |
Coal has been mined actively and extensively in the Appalachian coal region (fig. 1) since the mid-1800's. In some areas, production from major coal beds began to decline as early as 1907. Nevertheless, 40 percent of U.S. coal production still comes from the States of Ohio, Pennsylvania, West Virginia, Virginia, Maryland, eastern Kentucky, and Tennessee. These States contain six of the top coal-producing beds in the Appalachian basin -- the Pittsburgh, Upper Freeport, and Lower Kittanning coal beds in the northern Appalachian coal region and the Pond Creek, Fire Clay, and Pocahontas No. 3 in the central Appalachian coal region.
Even though many of these coal beds are still being mined at top production levels, information on the distribution and quality of remaining coal in the northern and central Appalachians is obsolete; in some areas, the last detailed maps of the coal beds were made nearly 90 years ago. To respond to present needs, including clean air standards and growing concern about potential hazardous pollutants in coal, we need up-to-date information on the amount of remaining coal, its quality, and its distribution.
The U.S. Geological Survey (USGS) National Coal Resource Assessment is assessing the Nation's top-producing coal beds and zones. The program, to be completed in 2000, will provide digital assessments of the quality and quantity of the top producing coals throughout the United States. In the northern and central Appalachians, the focus is on the six coal beds mentioned above. The assessment is being achieved through close partnerships with the State Geological Surveys of Ohio, Pennsylvania, West Virginia, Virginia, Maryland, Kentucky, and Tennessee. These States enter new data and data from published records that reside in the State archives into the National Coal Resource Data System (NCRDS). State data form the foundation of the assessment in the Appalachian coal region, and State participation is funded through the USGS State Cooperative project.
The primary products of the assessment of the northern and central Appalachians will be digital databases of detailed information on the six major producing coal beds. This information will be made available on a CD-ROM containing stratigraphic and geochemical databases of all nonproprietary information used in the assessment. In addition to basic data for each coal bed, the CD-ROM will provide estimates of original and remaining resources and a variety of maps, cross sections, and graphs (see the section entitled "The Pittsburgh Coal Bed -- An Example Assessment").
The CD-ROM will thus be a resource that provides a detailed, three- dimensional picture of the form and character of each of the assessed coal beds and the non-coal-bearing strata or "horizons" that are laterally continuous with them. When combined with coal quality data (ash yield, sulfur content, trace elements), a remarkably detailed picture of the resource emerges. With GIS technology, this detail can be presented in a variety of ways to satisfy diverse needs.
Maps can also be used as regional guides to pinpoint areas that may be vulnerable to other problems such as acid mine drainage. In the case of the Pittsburgh coal bed, for example, old mines are filling with water, creating a hydrostatic head that may drive acid waters into sensitive areas. By using the assessment areal extent, mining areas, and structure contour databases, potential avenues of drainage can be identified, and mitigation efforts put in place.
Tewalt, S.J., Ruppert, L.F., Bragg, L.J., Carlton, R.W., Brezinski, D.K., Yarnell, J.M., and Wallack, R.N., 1997, Map showing structure contours (sheet 1) and overburden isopleths (sheet 2) of the Pittsburgh coal bed in Pennsylvania, Ohio, West Virginia, and Maryland, digitally compiled by Tewalt, S.J., Wallack, R.N., and Tully, J.K.: U.S. Geological Survey Open-File 97- 864, scale 1:425,000, 2 sheets. Available on the World Wide Web at http://energy.er.usgs.gov/products
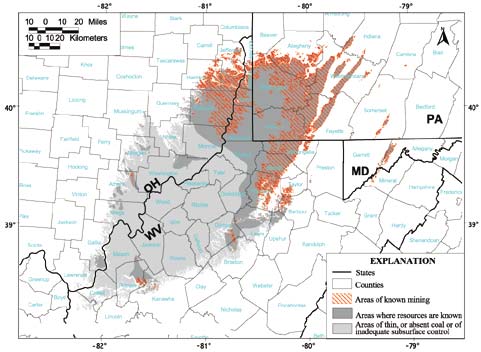
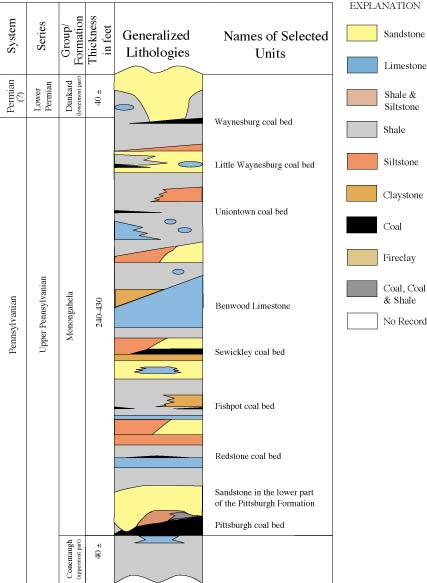
The Pittsburgh Coal Bed -- An Example AssessmentThe Pittsburgh coal bed (fig. 2), the top producer in the northern Appalachian region and the second largest producer in the Nation, is the first of the six coal beds in the northern and central Appalachian basin coal region to undergo full digital assessment. We are presenting data for the Pittsburgh coal bed as an example of the type of information that is being compiled during the assessment of coal resources in the Appalachian basin.
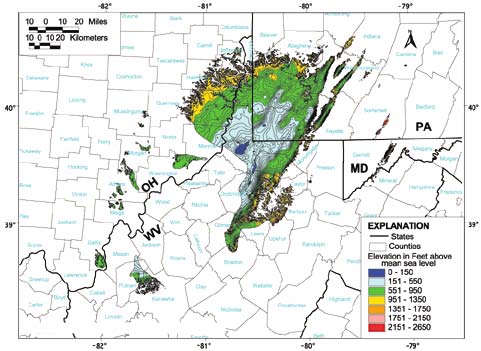
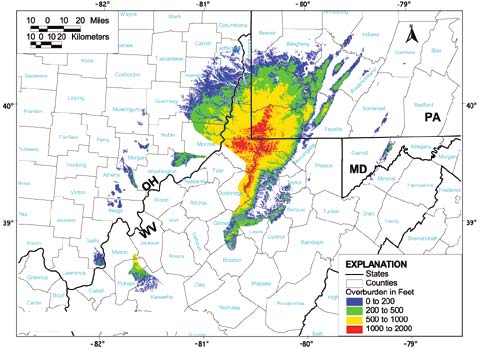
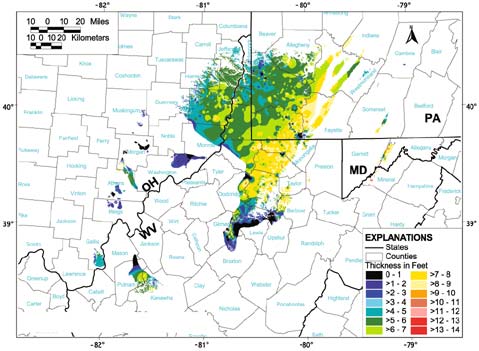
The stratigraphic database contains more than 5,000 descriptions from drill cores, mine locations, and outcrops, with an additional 2,000 records that contain data on coal elevation. The geochemical database consists of about 3,400 analyses of ash yield, sulfur content, and calorific value and about 160 analyses of selected major, minor, and trace elements. In addition, more than 100 paper maps at scales ranging from 1:24,000 to 1:250,000 were digitized to create a single GIS coverage of the extent of the coal bed. For each of the subject coal beds, a number of maps will summarize the information contained in the databases. The CD-ROM will provide maps of total extent and mined area (fig. 2), structure contour (or coal bed elevation) (fig. 3), overburden thickness (the material that overlies the coal) (fig. 4), and coal bed thickness (fig. 5). Table 1 presents mean ash yield, sulfur content, and calorific value (on an as-received basis) by State. In addition to these maps and charts, the CD-ROM will provide summary geologic cross sections, stratigraphic columns (fig. 6), and point-and-click maps that will allow the user to easily retrieve data for specific map localities. Resource information will also be available by State and county. In addition to the CD-ROM, the material compiled for each of the six major producing beds will be available on the World Wide Web.
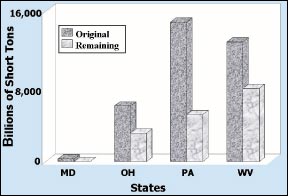
The remaining available, recoverable resource is less than 16 billion short tons. Various constraints on mining, including Federal and State mining regulations, land use and environmental regulations and concerns, geologic and technical factors, and economic realities limit the amount of the coal resource that is actually available for production. Studies completed in various regions within the eastern coal fields indicate that the recoverable resources may be as small as 4 percent of the original in-place amount. |
|
For more information, please contact:
Leslie (Jingle) Ruppert |

|
|||
|
U.S. Department of the Interior U.S. Geological Survey |
USGS Fact Sheet 115-99 October 1999 |