Fact Sheet 017–02
1 U.S. Geological Survey
2 British Antarctic Survey
 In 2009, the Glacier Studies Project
(GSP) of the U.S. Geological Survey (USGS) and the Mapping and Geographic Information Centre (MAGIC)
of the British Antarctic Survey (BAS) completed a cooperative endeavor to publish three maps of the Antarctic Peninsula region (figs. 1 and 2). The maps are based on a large variety of cartographic, aerial photograph, satellite image, and ancillary historical datasets archived at each institution. The maps document dynamic changes on the cryospheric coast of the peninsula during the past 50 years.
In 2009, the Glacier Studies Project
(GSP) of the U.S. Geological Survey (USGS) and the Mapping and Geographic Information Centre (MAGIC)
of the British Antarctic Survey (BAS) completed a cooperative endeavor to publish three maps of the Antarctic Peninsula region (figs. 1 and 2). The maps are based on a large variety of cartographic, aerial photograph, satellite image, and ancillary historical datasets archived at each institution. The maps document dynamic changes on the cryospheric coast of the peninsula during the past 50 years.
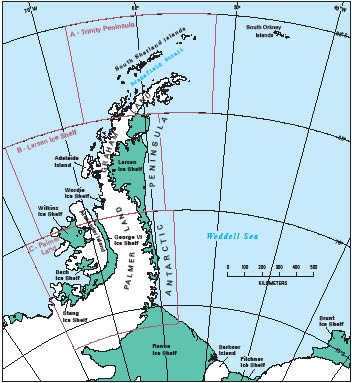
The three maps are part of a coastal change and glaciological map series (I–2600) being published by the USGS in both paper and digital format (see USGS Fact Sheet FS 2005–3055 at https://pubs.usgs.gov/fs/2005/3055/); the maps are of the Trinity Peninsula area (I–2600–A), the Larsen Ice Shelf area (I–2600–B), and the Palmer Land area (I–2600–C). The 1:1,000,000-scale maps encompass an area 1,800 kilometers (km) long and with an average width of 400 km (range of 200 to 600 km wide); the area is between lats 60° and 76° S. and longs 52° and 80° W. Each of the three maps includes an interpretive booklet that analyzes documented historical changes in the fronts of the ice shelves and termini of the outlet glaciers. For other maps published in the I–2600 series see https://pubs.usgs.gov/imap/2600/.
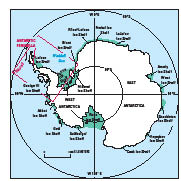
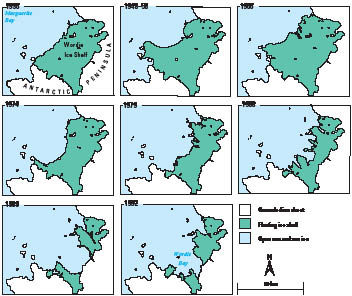
For much of the Antarctic Peninsula, the BAS used a georeferenced digital image mosaic from Landsat Thematic Mapper images prepared by the Institut für Angewandt Geodäsie (now the Bundesamt für Kartographie und Geodäsie) in Germany as an image-map base (backdrop). Thus, I–2600–A–C has a different base than the other maps of the series, which are georeferenced to a digital mosaic of RADARSAT images of Antarctica created by the Byrd Polar Research Center of Ohio State University. All digital cartographic data for I–2600–A–C have been incorporated into the Scientific Committee on Antarctic Research Antarctic Digital Database (ADD) (see http://www.add.scar.org:8080/add/). The ADD is a multinational project to maintain a digital cartographic database of Antarctica. The coastal-change and glaciological maps are valuable tools in studying changes along the cryospheric coast of Antarctica. The plan for the maps grew out of the 11-volume USGS Professional Paper 1386, “Satellite Image Atlas of Glaciers of the World,” an internationally authored publication which provides a mid-1970s baseline of the global areal extent of glaciers according to Landsat multispectral scanner (MSS) images (see USGS Fact Sheet FS 2005–3056 at https://pubs.usgs.gov/fs/2005/3056/ and URL: https://pubs.usgs.gov/pp/p1386/). The continent of Antarctica (fig. 1) is covered by the larger of the two remaining ice sheets on Earth. The Antarctic ice sheet encompasses an area of 13,949,000 km2 and a volume of 30,109,800 km3; only 0.33 percent of the continent has exposed bedrock. Changes in the area and volume of the Antarctic ice sheet, the Greenland ice sheet (1,736,095 km2, 2,600,000 km3), ice caps, ice fields, and the Earth’s smaller glaciers are related to the global hydrologic cycle. Glaciers represent about 2 percent of the Earth’s water in the form of freshwater ice, which, if completely melted, would raise sea level by more than 80 meters (see USGS Fact Sheet FS–02–00 at https://pubs.usgs.gov/fs/fs2-00/). Ice fronts, the floating edges of ice shelves and outlet glaciers, are the most dynamic and changeable features in the coastal regions of Antarctica. The Ross Ice Shelf and the Ronne Ice Shelf/ Filchner Ice Shelf have experienced major calving events historically, in which tabular icebergs many tens of kilometers long and wide have broken off. Such events, although irregular, are thought to be cyclical. In the Antarctic Peninsula region (fig. 2), however, the calving process of ice shelves during the past 50 years does not appear to be cyclical. Rather, the repeated calving events are resulting in the near-complete disintegration of some ice shelves (for example, Wordie Ice Shelf; figs. 2 and 3) and the breakup of others (Larsen Ice Shelf, figs. 1 and 2). The pronounced glaciological changes occurring in the Antarctic Peninsula region are the probable result of regional climate warming (+2.5°C since meteorological observations were initiated in the 1940s) and may even have global-climate-change implications. The ice shelves that fringe Antarctica (fig. 1) slow the flow of outlet glaciers. The loss of buttressing ice shelves causes outlet glaciers to accelerate their flow directly into the surrounding ocean. Any loss (melting) of grounded glacier ice above sea level from the Antarctic (and other glacierized regions on Earth) causes a global rise in sea level. Even the total melting of the small volume of ice in the Antarctic Peninsula region would raise global sea level by about 0.5 meters.
|
Revised September 2011 First posted December 2005 For additional information contact: Part or all of this report is presented in Portable Document Format (PDF); the latest version of Adobe Reader or similar software is required to view it. Download the latest version of Adobe Reader, free of charge. |
Ferrigno, J.G., Williams, R.S., Jr., Fox, Adrian, 2005, Coastal-change and glaciological maps of the Antarctic Peninsula: U.S. Geological Survey Fact Sheet 017–02, 2 p., at https://pubs.usgs.gov/fs/fs17-02/.

![]() U.S. Department of the Interior |
U.S. Geological Survey
U.S. Department of the Interior |
U.S. Geological Survey
URL: http://pubsdata.usgs.gov/pubs/fs/fs17-02/index.html
Page Contact Information: GS Pubs Web Contact
Page Last Modified: Tuesday, 29-Nov-2016 17:47:25 EST