U.S. Geological Survey

Monitoring Cyclical Changes in U.S. Metals Activity

Metals are key materials in durable goods manufacturing and construction, which together account for 25 percent of U.S. gross domestic product. But metals activity is highly sensitive to the business cycle During economic expansions metals production, employment, and sales can rise briskly. During recessions this activity can fall rapidly. The U.S. Geological Survey (USGS) monitors cyclical changes in U.S. metals activity each month by calculating and publishing special indexes in the Metal Industry Indicators. These indexes signal whether metals activity is likely to rise or fall in the near future because of significant changes in the business cycle.

Recent recessions severely affected the health of U.S. metal industries

Since 1969 the U.S. economy has experienced 4 recessions. During two of these recessions, between 1980 and 1982, U.S. metal industries underwent a longer and more severe downturn than most other U.S. industries. While the overall U.S. economy recovered from these recessions by the end of 1983 and grew for almost 7 years, this was not the case with the metal industries. Steel production has not fully recovered to production levels it reached before the 1980-82 recessions. Primary and secondary aluminum and primary copper production continued to experience cyclical declines into the late 1980's and early 1990's before reaching production levels last seen in 1979.

Metal Industry Indicators tracks changes in the business cycle that can affect the metal industries

Each month the USGS calculates and publishes leading and coincident indexes in the Metal Industry Indica- tors. Leading and coincident indexes are available for the broad primary metals industry and for specific industries that produce steel, primary and secondary aluminum, aluminum mill products, and copper. These indexes are similar to the leading and coincident indexes for the U.S. economy reported each month in the news. Each index combines different indicators of cyclical economic activity into one measure. The leading indexes are constructed from measures of various economic activities that can affect the metal industries in the months ahead. They lead, that is, they give early signals, several months in advance of major changes in metal industry activity measured by a coincident index. The coincident index describes current industry conditions and can be regarded as a measure of the basic health of the metals industry. Examples of indicators in the leading index include new orders received for metals, permits issued for construction of new housing, and changes in the growth rate of metal prices. Examples of coincident indicators include metal industry production, shipments, and total employee hours worked in metal producing establishments. The metal industry indexes were developed with assistance from the Center for Inter- national Business Cycle Research at Columbia University. The USGS also calculates and publishes a leading index of metal prices in the Metal Industry Indicators. This leading index anticipates changes in the growth rate of a nonferrous metals price index of prices for primary aluminum, copper, lead, and zinc.

The Metal Industry Indicators aids decision and policy makers concerned with metals activity

Decision and policy makers in mining, manufacturing, recycling, finance, government, and academia use the Metal Industry Indicators to determine where the metal industries are in the business cycle. News organizations, such as BRIDGE News, The Wall Street Journal, and The New York Times, report the trends of the metal industry indexes to the business community. The Federal Reserve Bank of Chicago and a major mutual fund use the Metal Industry Indicators to analyze the effects of the business cycle on steel industry production and profitability. Several Wall Street firms use the Metal Industry Indicators to track the trend of metal prices, and the purchasing departments of capital goods producers use it to make decisions about purchasing metals. Indexes published in the Metal Industry Indicators are time-sensitive, so the report is made available, electronically and by mail, to customers worldwide by the end of each month.

chart
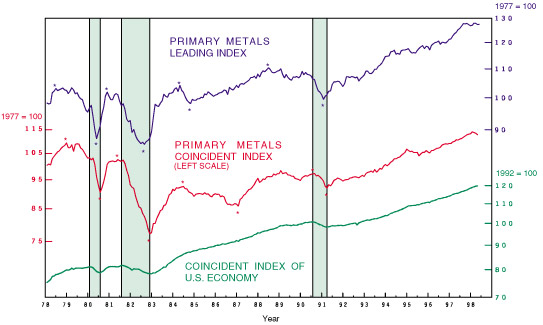
Shaded areas are economic recessions. Asterisks (*) signify highs (the end of economic expansions) and lows (the end of economic downturns) reflected by the indexes. Note that leading index highs and lows occur before highs and lows of the coincident indexes, which measure current economic activity. The indexes give clues regarding the present and near-term future growth of the U.S. metals industry. The effects of the last three recessions on the primary metals industry vary greatly. The late 1970's and early 1980's were periods of high inflation, which increased industry costs. Interest rates rose dramatically. Metals prices, however, did not keep pace with inflation. When the recessions of the early 1980's occurred, activity in the U.S. metal industries declined severely. During and after the 1981-82 recession, the metal industries cut employment, shut down facilities, and brought other costs under control. When the next recession occurred in 1990-91, the downturn in total metal industry activity was not as deep as the previous recession. The primary metals coincident index grew 23 percent from the end of the last recession in March 1991 through the end of 1997. In 1997 the coincident index finally reached the level it achieved in December 1978, before the industry began declining through the early 1980's.

Recent research at the USGS identified economic indicators that improved the metal industry leading indexes

The original leading indexes, which were constructed in the early 1990's, led each metal industry coincident index by an average of 6 months in advance. Analysts at the USGS recently succeeded in constructing new leading indexes with lead times over their coincident indexes of 9 months for primary metals, 8 months for steel, and 7 months for copper. The average lead times for the aluminum mill products and primary and secondary aluminum leading indexes remain at 6 months. The improved leading indexes are now published in the Metal Industry Indicators and provide users with earlier warnings of significant changes that could affect metals activity.


For more information, please contact:
Ken Beckman
Telephone: (703) 648-4916
E-mail: kbeckman@usgs.gov
Gail James
Telephone: (703) 648-4915
E-mail: gjames@usgs.gov
 
U.S. Geological Survey
988 National Center
Reston, VA 20192


U.S. Department of the Interior
U.S. Geological Survey
                                                  USGS Fact Sheet FS-071-98
September 1998

This page is https://pubs.usgs.gov/factsheet/fs71-98/
Maintained by Eastern Publications Group Web Team
Last revised 2-4-99