National Water-Quality Assessment (NAWQA) Program
Nitrate contamination of ground water occurs in predictable patterns, based on results of the U.S. Geological Survey's (USGS) National Water-Quality Assessment (NAWQA) Program. The NAWQA Program was begun in 1991 to describe the quality of the Nation's water resources, using nationally consistent methods. Soil-drainage characteristics and the amount of nitrogen contributed by fertilizer, manure, and atmospheric sources were found to markedly influence the concentration of nitrate in ground water. These two characteristics were compiled in a national map that shows patterns of risk for nitrate contamination of ground water (figure 1). Areas with well-drained soils and high nitrogen input (shown in grayish blue on the map) have the highest risk. Ground-water nitrate data generally verified the risk patterns shown on the national map. The verification analysis is based on over 10,000 samples collected through 1992.
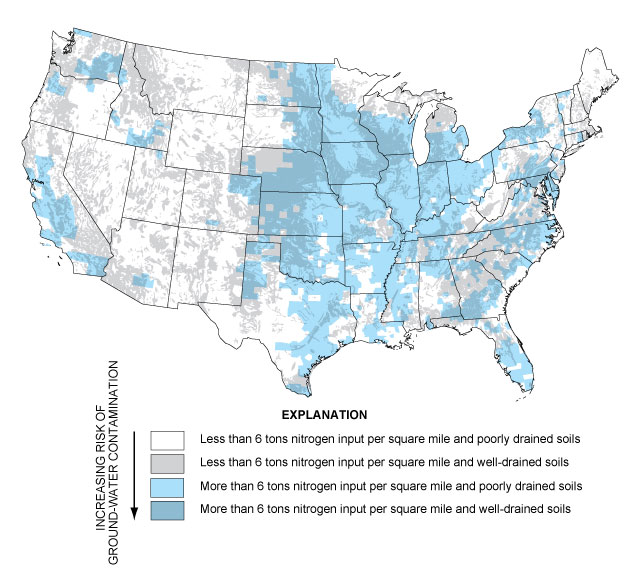
Figure 1.--Areas in the United States most vulnerable to nitrate contamination of ground water (shown in grayish blue on the map) generally have well-drained soils and high nitrogen input from fertilizer, manure, and atmospheric deposition. High-risk areas occur primarily in the western, midwestern, and southeastern portions of the Nation.
Ground water provides drinking water for more than one-half of the Nation's population (Solley and others, 1993). In 1990, ground water accounted for 39 percent of water withdrawn for public supply for cities and towns and 96 percent of water withdrawn by self-supplied systems for domestic use. Ground water is the sole source of drinking water for many rural communities and some larger cities. A variety of chemicals, including nitrate, can pass through the soil and potentially contaminate ground water. Nitrate comes from nitrogen, a plant nutrient supplied by inorganic fertilizer and animal manure. Additionally, airborne nitrogen compounds emitted by industry and automobiles are deposited on the land. Other nonagricultural sources of nitrate, such as septic systems, generally are less significant and are not shown on the national map. Beneath agricultural lands, nitrate is the primary form of nitrogen. It is soluble in water and can easily pass through soil to the water table. Nitrate can persist in ground water for decades and accumulate to high levels as more nitrogen is applied to the land surface every year.
Although nitrate generally is not an adult public-health threat, ingestion in drinking water by infants can cause low oxygen levels in the blood, a potentially fatal condition (Spalding and Exner, 1993). For this reason, the U.S. Environmental Protection Agency (1995) has established a drinking-water standard of 10 milligrams per liter (mg/L) for nitrate. Nitrate concentrations in natural ground waters are usually less than 2 mg/L (Mueller and others, 1995).
Knowing where and what type of risks to ground water exist can alert water-resource managers and private users of the need to protect water supplies. By targeting regions with the highest risk of nitrate contamination, resources can be directed to areas most likely to benefit from pollution-prevention programs and long-term monitoring. Use of risk guidelines to locate areas for prevention of contamination might cost less than simply identifying the most severely contaminated areas. Once ground water is contaminated, it is expensive and in many cases virtually impossible to clean up (National Research Council, 1993).
Risk of ground-water contamination by nitrate varies across the United StatesThe risk of ground-water contamination by nitrate is not the same everywhere. Figure 1) shows four groups in order of increasing risk:
Figure 1 indicates that the Midwest has a higher risk of contamination, but that parts of the western and southeastern United States also are at risk. The grayish blue areas generally have well-drained soils and high amounts of nitrogen applied to the land surface. Well-drained soils can easily transmit water and nitrate to ground water. In contrast, the other three groups have a lower risk of nitrate contamination because of poorly drained soils and/or low nitrogen input. Poorly drained soils transmit water and chemicals at a slower rate than well-drained soils (Mueller and others, 1995). Drains and ditches commonly are used to remove excess water from poorly drained agricultural fields, diverting nitrate to nearby streams.
Nitrate in ground water generally follows the risk mapGround-water nitrate data from across the Nation were analyzed to verify the four risk groups shown on the national map. Nitrate concentration in ground water increases with higher nitrogen inputs and more well-drained soils. People who live in areas shown in grayish blue on the national map and who get their water from shallow wells are more likely to drink high-nitrate ground water. Figure 2 shows the median concentration of nitrate in water from shallow wells in agricultural areas and the percent of wells with nitrate that exceeds the drinking-water standard (10 mg/L) for each of the four risk groups. The bars in figure 2 represent risk groups with the same color shown on the national map. Median nitrate concentration and percentage of wells from which water exceeds the drinking-water standard for nitrate are lowest in poorly drained soils with low nitrogen input (white color) and highest in well-drained soils with high nitrogen input (grayish blue color).
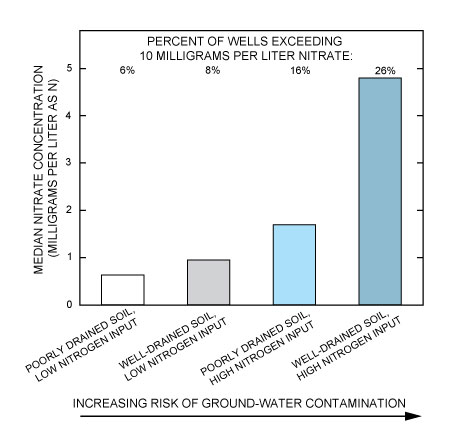
Figure 2.--Nitrate concentration in shallow ground water beneath agricultural lands varies by soil permeability and the amount of nitrogen applied to the land surface.
Data for specific locations give examples of the difference in risk. Ground water in the grayish blue area in southeastern Washington State has a median nitrate concentration of 6.5 mg/L. In contrast, ground water in the white and gray areas in western New Mexico, where nitrogen input is low, has a median nitrate concentration of 0.3 mg/L. Poorly drained soils can reduce the risk of ground-water contamination, even in areas with high nitrogen input. For example, ground water in light blue areas in southern Indiana has a median nitrate concentration of only 0.1 mg/L. Although nitrogen input is high, most soils in the area are poorly drained, which restricts the movement of nitrate to the water table (Mueller and others, 1995). Additionally, drains and ditches carry soil water off to streams rather than letting it seep to ground water.
Data from two areas--the southeastern United States and Long Island, New York--did not reflect very well the risk of ground-water contamination shown in figure 1. Ground-water nitrate concentration generally is low in the Southeast, despite high nitrogen input and, in some areas, well-drained soils. For example, grayish blue areas in southern Georgia and northern Florida indicate higher risk, yet the median nitrate concentration in ground water is only 1.0 mg/L. Nitrate levels in shallow ground waters of the Southeast can be reduced by dilution, denitrification, and uptake by plants (Hubbard and Sheridan, 1989). Denitrification, a process that converts nitrate to nitrogen gas, is fueled by organic matter in water-logged soils (Weil and others, 1990). Other factors not shown on the national map but that can affect nitrate concentration in ground water include land use, aquifer type, and rainfall and irrigation amounts.
Nitrate concentration in ground water on Long Island, New York (median of 9.4 mg/L), is higher than expected from the map, even though nitrogen inputs contributed by fertilizer, manure, and atmospheric sources are low. Septic systems and cesspools in developed areas of Long Island have been a major source of nitrogen in ground water since the 1930's (Porter, 1980). Residential sources such as these are not yet included on this national map but are likely to be important for locations with well-drained soils like Long Island.
Who is most likely to drink high-nitrate ground water?Where people live and their source of water determine the quality of the water they drink. In figure 3, three types of wells are shown for the highest risk (grayish blue) areas, which have high nitrogen input and well-drained soils. People who get their water from domestic wells are more likely to drink water that contains high concentrations of nitrate than those who get their water from public-supply wells. Public-supply wells typically are completed in deeper ground-water reservoirs where contamination is less likely to occur (Mueller and others, 1995). In contrast, domestic wells usually are shallower and located closer to potential sources of nitrate contamination. Median nitrate concentration and percent of wells in which water exceeds the drinking-water standard for nitrate are highest for domestic wells in agricultural areas.
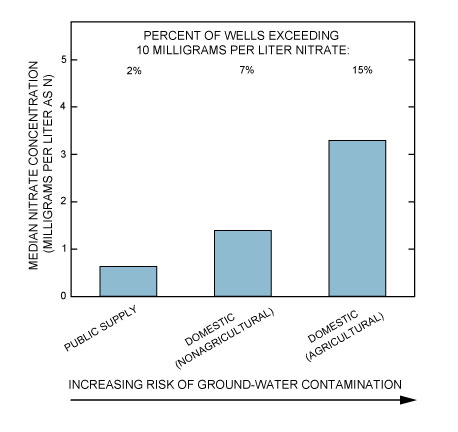
Figure 3.--Nitrate concentration is higher in domestic wells in agricultural areas than in public-supply wells (all land-use areas) and domestic wells in nonagricultural areas. (Data shown are for well-drained soils with high nitrogen input.)
SummaryWidespread water-quality sampling over large areas is expensive and time-consuming. Benefits can be maximized by understanding where ground water is most at risk. By determining characteristics that influence ground-water contamination by nitrate, USGS scientists have been able to map high- and low-risk areas of the Nation. Areas with the highest risk have high nitrogen input and well-drained soils. Although local variations from regional patterns of contamination risk occur, data generally support the national map. Continued development of this predictive tool will help water-resource managers direct scarce funds to where they are most needed.
ReferencesHubbard, R.K., and Sheridan, J.M., 1989, Nitrate movement to groundwater in the southeastern Coastal Plain: Journal of Soil and Water Conservation, v. 44, p. 20-27.
Mueller, D.K., Hamilton, P.A., Helsel, D.R., Hitt, K.J., and Ruddy, B.C., 1995, Nutrients in ground water and surface water of the United States--An analysis of data through 1992: U.S. Geological Survey Water-Resources Investigations Report 95-4031, 74 p.
National Research Council, 1993, Ground water vulnerability assessment--Contamination potential under conditions of uncertainty: Washington, D.C., National Academy Press, 204 p.
Porter, K.S., 1980, An evaluation of sources of nitrogen as causes of ground-water contamination in Nassau County, Long Island: Ground Water, v. 18, no. 6, p. 617-625.
Spalding, R.F., and Exner, M.E., 1993, Occurrence of nitrate in groundwater-- A review: Journal of Environmental Quality, v. 22, no. 3, p. 392-402.
U.S. Environmental Protection Agency, 1995, Drinking water regulations and health advisories: Washington, D.C., Office of Water, U.S. Environmental Protection Agency, 11 p.
Weil, R.R., Weismiller, R.A., and Turner, R.S., 1990, Nitrate contamination of groundwater under irrigated Coastal Plain soils: Journal of Environmental Quality, v. 19, p. 441-448.
Additional readingMore detail on these data is found in the USGS report "Nutrients in Ground Water and Surface Water of the United States--An Analysis of Data through 1992," by Mueller and others (1995). For information about obtaining copies of this and other USGS reports, contact :
Chief, NAWQA Program U.S. Geological Survey 413 National Center Reston, VA 20192 The E-mail address for the NAWQA Program is: gs-w_nawqa_info@usgs.govThe data set on which this fact sheet is based and information on the NAWQA Program are online.
The National Water-Quality Assessment (NAWQA) ProgramThe USGS began the NAWQA Program in 1991 to assess the status of and trends in the quality of the Nation's streams and ground waters. The program is designed to enhance understanding of natural and human factors that influence water quality, and consists of studies in 60 major river basins and aquifers of the United States. Together, the 60 studies compose about one-half of the land area of the United States and 60 to 70 percent of the water use and population served by public water supplies. The similar design of each study and use of consistent methods allow comparisons at regional and national scales. This information is being used to guide policy and to manage water resources at the national, State, and local levels.
More information is available on the NAWQA Home Page.
| AccessibilityFOIAPrivacyPolicies and Notices | |
 |
|