![]()
|
|
Major Results | Comparison
to Previous Studies | Call to Action
|
| Calculating the Earthquake Odds | |
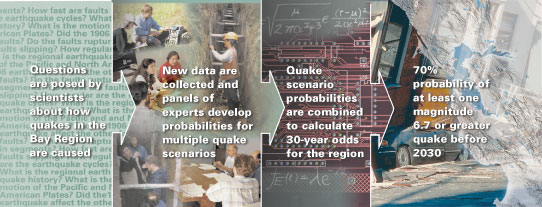
| In 1997, the U.S. Geological Survey's (USGS) Working Group on California Earthquake Probabilities was expanded to include more than 100 geologists, seismologists, geophysicists, and mathematicians. This group, known as WG99, calculated new quake odds for the San Francisco Bay region based on insights gained since the 1989 Loma Prieta earthquake. WG99 concluded that there is a 70% probability (±10%) of at least one magnitude 6.7 or greater quake, capable of causing widespread damage, striking the region before 2030. The process used to determine these odds is described below. |
 |
Balancing Plate Motions and Earthquakes
Quake probabilities for the San Francisco Bay region are derived by balancing two processes–(1) the motions of the plates that make up the Earth's outer shell and (2) the slip on faults, which occurs primarily during earthquakes. The continual northwestward motion of the Pacific Plate past the North American Plate loads strain onto the network of active faults that slice through the region. Earthquakes sporadically release and redistribute this strain. WG99 combined geology, physics, and statistics to balance these processes and calculate quake odds.
One side of the balance is the rate at which plate motions load strain onto faults. Development of the Global Positioning System (GPS) has allowed geophysicists to make accurate measurements of how the current plate motions–totaling 1.5 inches per year across the entire region–distributes strain onto individual faults. Geologic studies also contribute to this understanding by documenting long-term fault motions, which must match the strain-loading rate. For example, on the San Gregorio Fault near Moss Beach, a buried stream channel has been offset about 1,000 feet over the past 80,000 years. This indicates that the strain rate there is about one-sixth of an inch per year, a small fraction of the total regional plate motions. Offshore studies reveal other active strands of the San Gregorio Fault that account for additional strain.
The other side of the balance is the slip on faults, which over time must account for the strain built up by the plate motions. Slip on faults (movement of one side of a fault relative to the other) can occur either during earthquakes or during slow, aseismic (without earthquakes) creep. For example, creep on the Hayward Fault is slowly offsetting street curbs, even in the absence of large quakes. Where aseismic creep occurs, it affects the balance between plate motions and earthquakes by relieving strain, which can either change the likelihood or lower the magnitude of future quakes. Nevertheless, most slip on faults occurs during earthquakes–the larger the quake, the greater the slip.
 |
Quake probabilities are derived by balancing two processes—(1) the continual motions of the plates that make up the Earth's outer shell (represented by pouring sand onto the left tray) and (2) the slip on faults, which occurs primarily during earthquakes (equivalent to adding balls to the right tray). The slip on faults over time must balance the strain built up by the plate motions. The total amount of slip during an earthquake, shown here by proportional volumes ot the spheres, depends on its magnitude(M). The larger the quake, the more strain released. |
Earthquake History
Knowledge of past earthquakes indicates what sizes of quakes to expect in the future. The most accurate locations and magnitudes exist for quakes recorded on seismographs, which came into widespead use about 1900. However, this record is too short to understand the pattern of earthquakes over geologic time. Historical accounts of damage help identify and locate quakes that occurred before there were adequate seismographic records (seismograms), but such accounts are fragmentary in northern California before 1850. Scientists reanalyzed seismograms and historical accounts as part of WG99's efforts.
To go back even further in time, geologists dig trenches across faults to uncover earthquake ruptures that once reached the surface but now are buried. Many new trenches across Bay region faults expose the ancient earthquake history. For example, a trench in El Cerrito revealed evidence of four to seven large quakes on the Hayward Fault during the past 2,200 years.
Understanding Faults
Data from trenches, historical accounts, and seismograms provide incomplete information about quakes in the San Francisco Bay region. Supplementing this with up-to-date knowledge about how faults work allows scientists to make better projections of the expected sizes of future earthquakes. Many earth scientists believe that faults are composed of segments that may rupture individually or in groups of adjacent segments during an earthquake, and WG99 used this concept. Larger quakes rupture greater fault lengths and produce more slip. For example, the magnitude 7.8 San Francisco earthquake of 1906 ruptured 300 miles of the San Andreas Fault and produced as much as 30 feet of slip, whereas the magnitude 6.9 Loma Prieta quake in 1989 ruptured only 25 miles of fault and produced only about 6 feet of slip. If scientists can identify the lengths of fault segments that may fail together in an earthquake, they can estimate the magnitudes and amounts of slip for possible future quakes. Earth scientists identify fault segments by studying bends, intersections, and gaps in faults, past earthquakes, and major changes in rock types along faults. One example of how past earthquakes define segments is the 1868 magnitude 6.9 quake on the Hayward Fault. This quake ruptured only the southern part of the fault, defining that part as a segment that can rupture separately. However, WG99 concluded that an even-larger earthquake might rupture the entire Hayward-Rodgers Creek Fault.
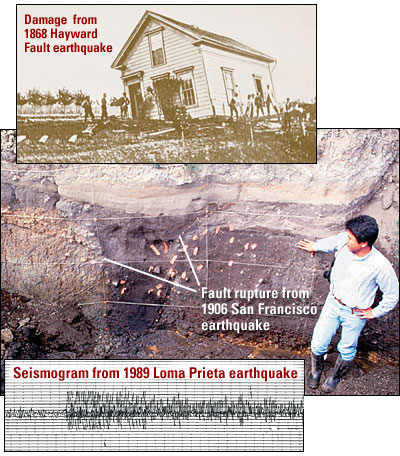 |
Knowledge of past earthquakes is essential for estimating the odds of future temblors. This knowledge comes from (top to bottom) historical damage accounts, fault ruptures exposed in trenches, and seismographic records. |
Finding New Faults
In addition to identifying fault segments, WG99 looked for previously unknown faults. Most faults in the San Francisco Bay region have "strike-slip" motion, in which the two sides of the fault slip horizontally past each other. In contrast, ramp-like "thrust" faults have vertical motion and often do not reach the Earth's surface, making them difficult to find. The importance of locating these hidden faults was underscored by the devastating 1994 Northridge earthquake in southern California, which occurred on a previously unknown thrust fault.
Of the known thrust faults in the Bay region, only the Mount Diablo Thrust Fault has a high enough slip rate to be included in WG99's calculations. To account for the small percentage of large earthquakes that occur on minor or unknown faults (both strike slip and thrust), WG99 estimated probabilities for such quakes on the basis of the rate of similar quakes in the historical record.
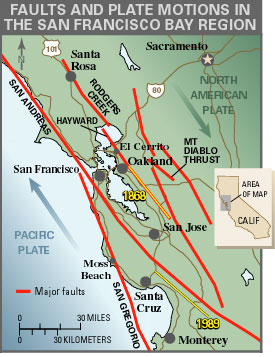 |
The San Francisco Bay region lies on the boundary zone between two of the tectonic plates that make up the Earth's outer shell. The relentless motion of these plates builds up strain that will eventually be released in earthquakes on the region's many faults. The lengths of fault that slipped in the 1868 Hayward and 1989 Loma Prieta magnitude 6.9 earthquakes are shown in yellow. |
A New Method for Determining Quake Odds
Scientists can best determine earthquake probabilities for a fault once they know when it last ruptured, the sizes of possible quakes, and the rates of plate motions. For example, if plate motions are loading a fault at 1 inch per year, the fault will accumulate 100 inches of strain in 100 years. If each earthquake on that fault releases 100 inches of slip and there is no aseismic creep, then one quake can be expected every 100 years. If the occurrence of that earthquake is equally likely at any time, the odds of it striking would be 1% in any given year. However, many earthquake experts believe that once a fault slips, plate motions must load strain back onto that fault before the next quake can occur. If quakes occurred with perfect regularity, then in this example they would occur exactly 100 years apart, and the odds of a quake would be 0% for the first 99 years and 100% for the final year.
Earthquakes, however, are not that predictable. WG99 therefore developed a new set of models that use both physics and statistics. In these models, quakes are caused by a combination of constant plate motions and a random process that accounts for variations in earthquake sizes and occurrence. These models closely mimic the occurrence of quakes around the world.
Because every earthquake changes strain on nearby faults, another important element in the WG99 method is the inclusion of interactions between faults in the San Francisco Bay region. For example, the rate of large quakes in the region was high in the late 1800's but abruptly dropped after the 1906 San Francisco earthquake. Scientists believe that this rate dropped because the San Andreas Fault slipped so much over such a great length in 1906 that the strain was reduced on most faults throughout the Bay region. Because plate motions are continuous, strain has been slowly building up again, and strong earthquakes began to occur again in the 1980's. However, the level of seismic activity has not yet reached that of the late 1800's (see rate of large earthquakes diagram).
The WG99 method for determining earthquake probabilities involves making many decisions, such as defining fault segments and choosing among alternative statistical models. Every such decision is uncertain, but WG99 members assigned weights to the various choices so that all of them were included in their overall calculations.
This process helps ensure that the WG99 probabilities are reliable estimates of the earthquake threat faced by the San Francisco Bay region between 2000 and 2030. The WG99 method will also allow the USGS to update these probabilities as new insights are gained.
|
|
Major Results | Comparison
to Previous Studies | Call to Action
|
| Calculating the Earthquake Odds | |